| Followers | 689 |
| Posts | 143817 |
| Boards Moderated | 35 |
| Alias Born | 03/10/2004 |
Sunday, May 09, 2021 12:54:43 PM
The Fuse Has Been Lit In Commodity Prices
By: Mark J Lundeen | May 9, 2021
This week the market saw lots of excitement, like the Dow Jones seeing three new BEV Zeros from Wednesday to Friday. These three new all-time highs pushed the Dow Jones up 903 points, or 2.67% above last week’s close.
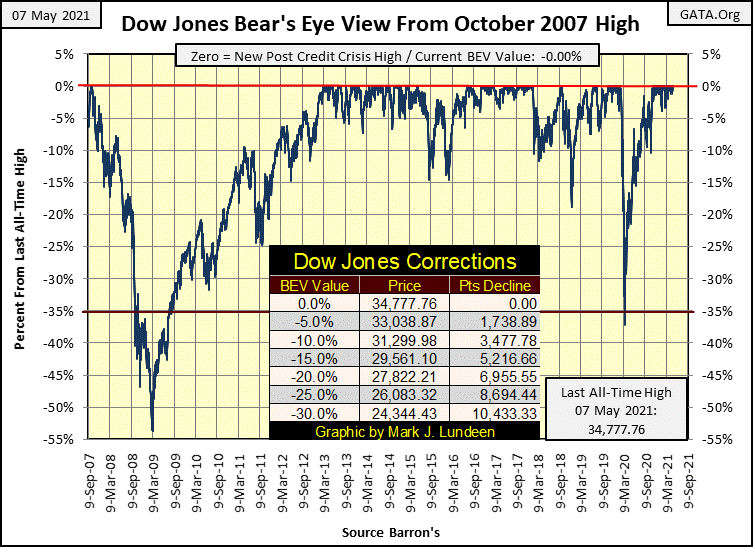
However, a BEV plot by design underplays advances into record territory. The Dow Jones could have closed above 50,000 this week and its BEV chart above would look no different. So, let’s see what the Dow Jones (Blue Plot) looks like with its 52Wk High (Green Plot) and 52Wk Low (Red Plot) below.
First and foremost, in the chart below we see the effect of monetary inflation flowing from the FOMC has on historical market valuations. The Housing Bubble bear market was the Dow Jones’ second deepest percentage decline (54%) since 1885; impressive! This epic bear market decline induced panic not just in the market, but in Government too.
Still, due to monetary inflation flowing from the FOMC these past thirteen years, inflating the Dow Jones’ valuation by 28,230 points from its 09 March 2008 bottom, the second deepest percentage decline in the Dow Jones seen below doesn’t seem like such a big deal today.
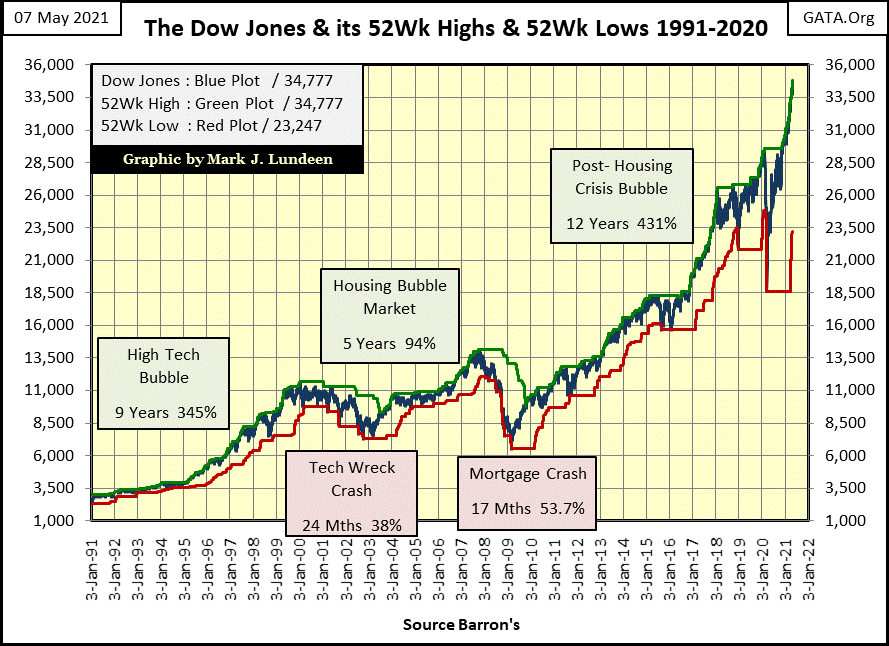
Maybe, when compared to what the pending bear market might look like, (possibly a repeat of the Great Depression’s 90% market deflation), the 2007-09 54% market decline is tame stuff. From this week’s close, a 90% market decline would be a 31,300 point loss for the Dow Jones, the Dow Jones would close at 3,478. So, maybe in the years and decades to come, the Housing Market crash isn’t destined to be a big deal.
Golly gee Mark, you are always too bearish! In my defense, I have to say that inflation from the FOMC isn’t just inflating market valuations, it’s also creating debt burdens on corporate, government and individual balance sheets that are crushing. When the economy enters another recession, which it will, the debt burdens it must carry will amplify its deflationary effects many times, as defaults and bankruptcies bloom like flowers in spring.
How’s that for putting a positive spin on a bad situation!?
Now let’s look at the Bear’s Eye View values for major market indexes I follow in the table below. And for your information, it’s not just the valuation for the Dow Jones that has inflated greatly from their March 2009 bottoms. Looking at these market indexes’ BEV values we don’t get a clue of that. Still this week we saw lots of new all-time highs (BEV Zeros) in the table below.
I also note the XAU (Gold & Silver Mining) is about to break above its BEV -30% line, something not seen since January 2013. In a good market, a market that saw gold and silver bullion making big strides towards their all-time highs, the XAU could be at new all-time highs by August. That’s not a prediction, just a comment on the potential for the mining shares in the months to come.
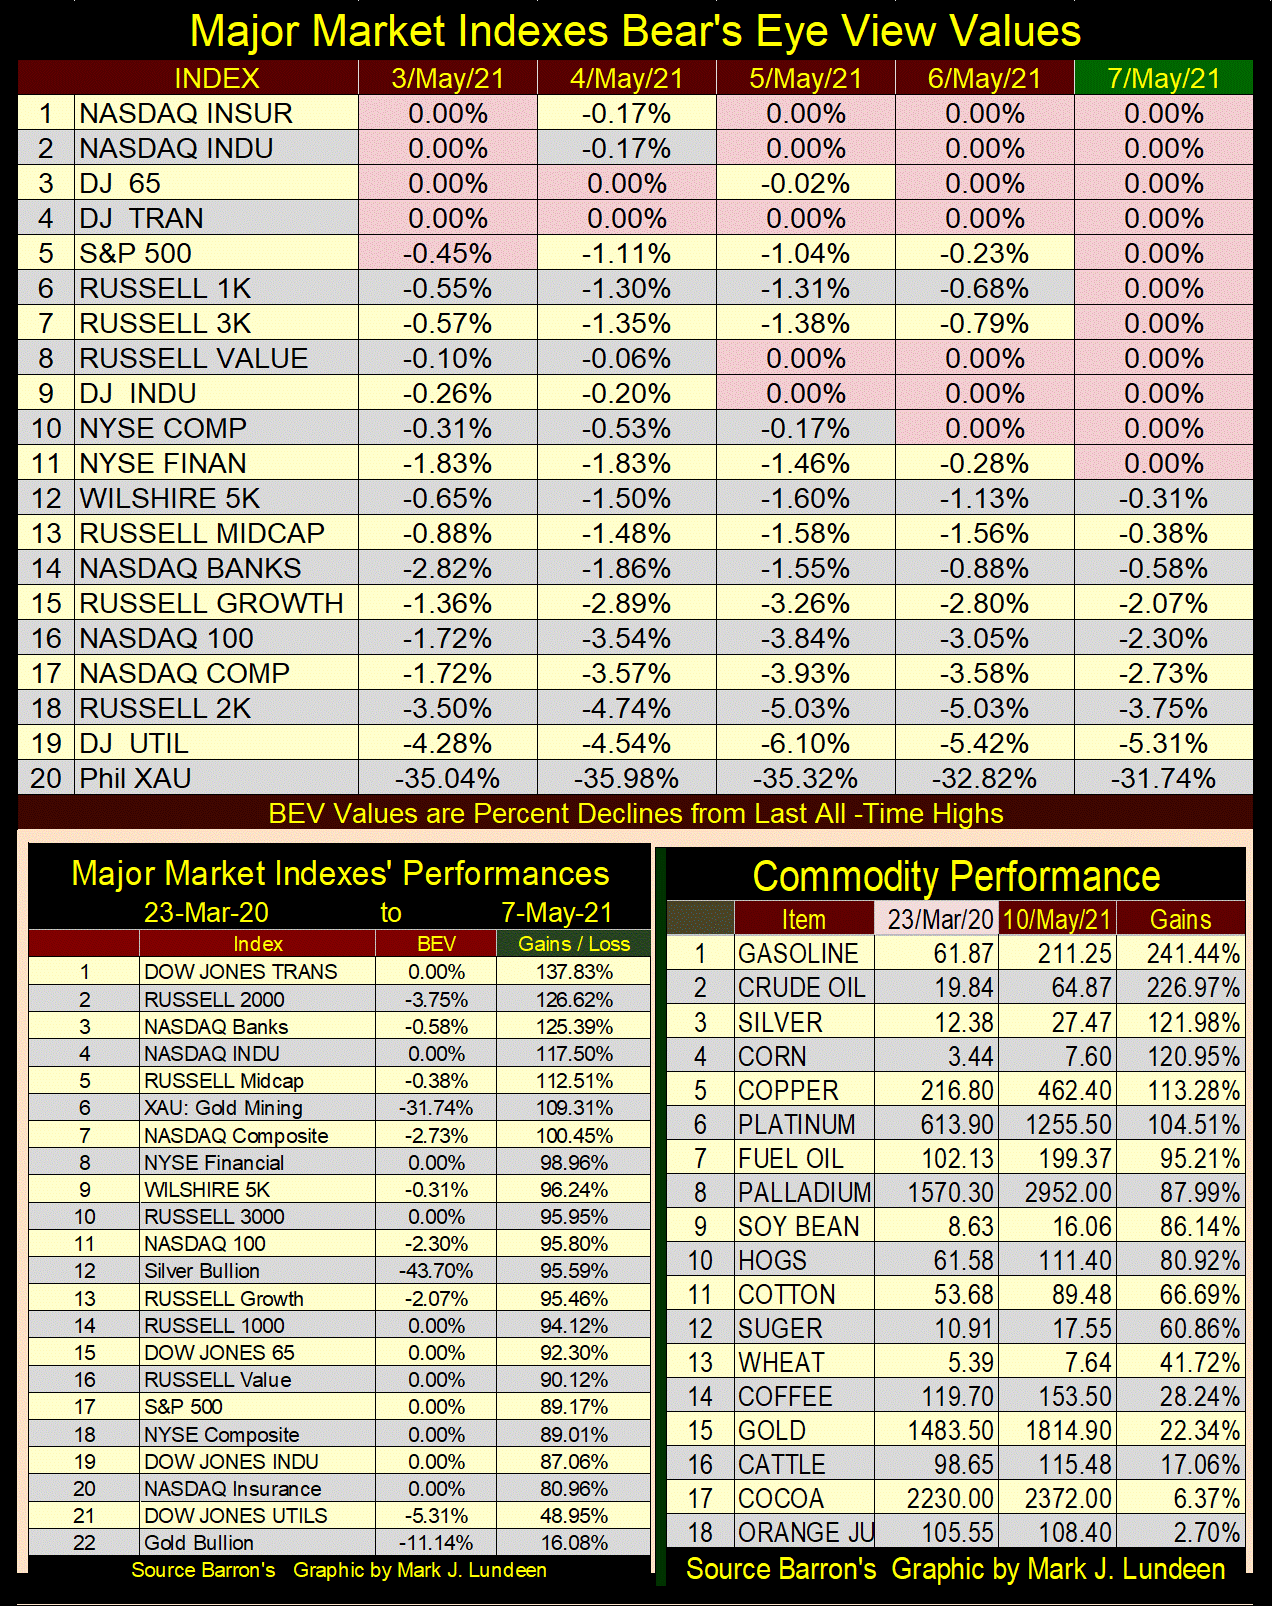
When we look at these market indexes’ gains off their 23 March 2020 lows in the table above (left side), the XAU is already at #6 in the list. Silver is #12, and gold remains tail-end Charlie at #22.
These double- and triple-digit percentage advances in the stock market since March 2020 are amazing. But then the Federal Reserve has expanded its balance sheet by 88% since February 2020 too. Market valuations have benefitted from this. The alarming thing about the FOMC’s current bout of inflation is to be seen in the table above (right side) listing commodity price increases off their March 2020 bottoms.
I go into more detail below, but keep in mind increases in energy prices (#1&2 right-side above) far exceed gains in the stock market, as basic food prices such as grains and meats are all up by double digit percentages. That isn’t just bad for the stock market, but potentially fatal for the bond market too should these trends continue.
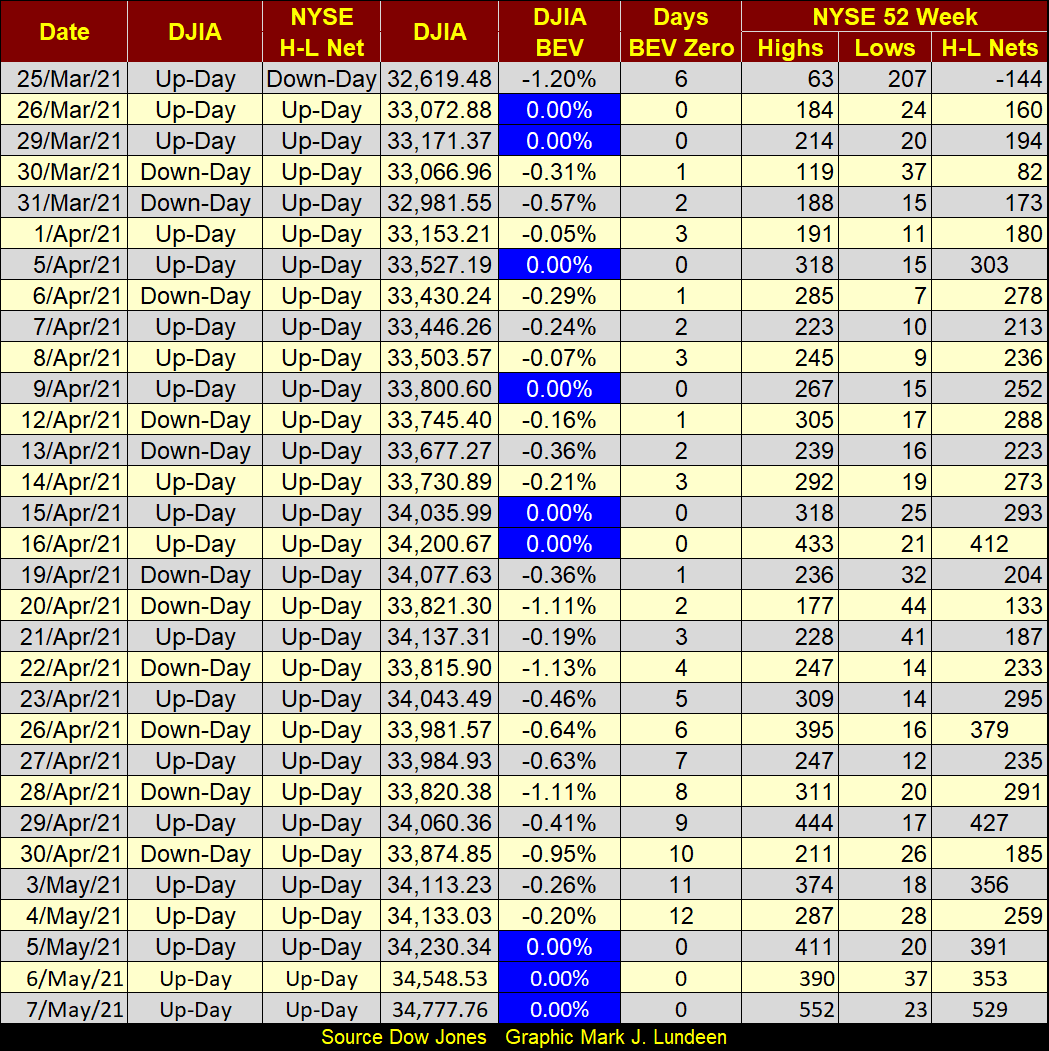
The NYSE 52Wk H-L Nets continue to break above my threshold of +300. On Friday the NYSE saw a 52Wk H-L Net of +529 – wow! So, to Mark Lundeen from the bulls on Wall Street – you and your commodity prices can kiss off! We’re running wild and free on Wall Street, and loving it!
As much as we all love seeing Wall Street’s bulls dancing with happy feet, a fuse has been lit in consumer prices. If current trends in commodity prices isn’t reversed, it’s only a matter of time before interest rates and bond yields begin to rise uncontrollably. That will put massive downward pressure on financial market valuations, while the Federal Reserve stands aside, impotent from doing anything to stop Mr Bear.
What fuse is that? As seen below, since 1957 the commodity market is seeing another, the third of its post Bretton Woods’ base-line shifts (BL Shift) developing.
What’s a base-line shift? A BL Shift has occurred when old price resistance levels (high prices that have not been exceeded for years or decades) become new price support levels; low prices the market refuses to fall below.
Take a quick look at the six commodities plotted below, and what happened after:
• August 1971 when the US took the dollar off the Bretton Woods $35 gold peg,
• October 2002 when the “policy makers” decided to reinflate the stock market after the Dot.Com bubble popped, by inflating yet another bubble in the single-family home mortgage market.
Both these “monetary initiatives” resulted in a base-line shift in commodity prices, with the second BL Shift shifting into high gear after 2008 when Dr. Bernanke implemented his QEs. And now, fourteen months after Chairman Powell began his Not QE#4, a “monetary initiative” that “injected” over $1 trillion dollars into the financial system in the single month of April 2020, and $3.34 trillion in total since, price trends in these commodities strongly suggest a third BL Shift is currently developing.
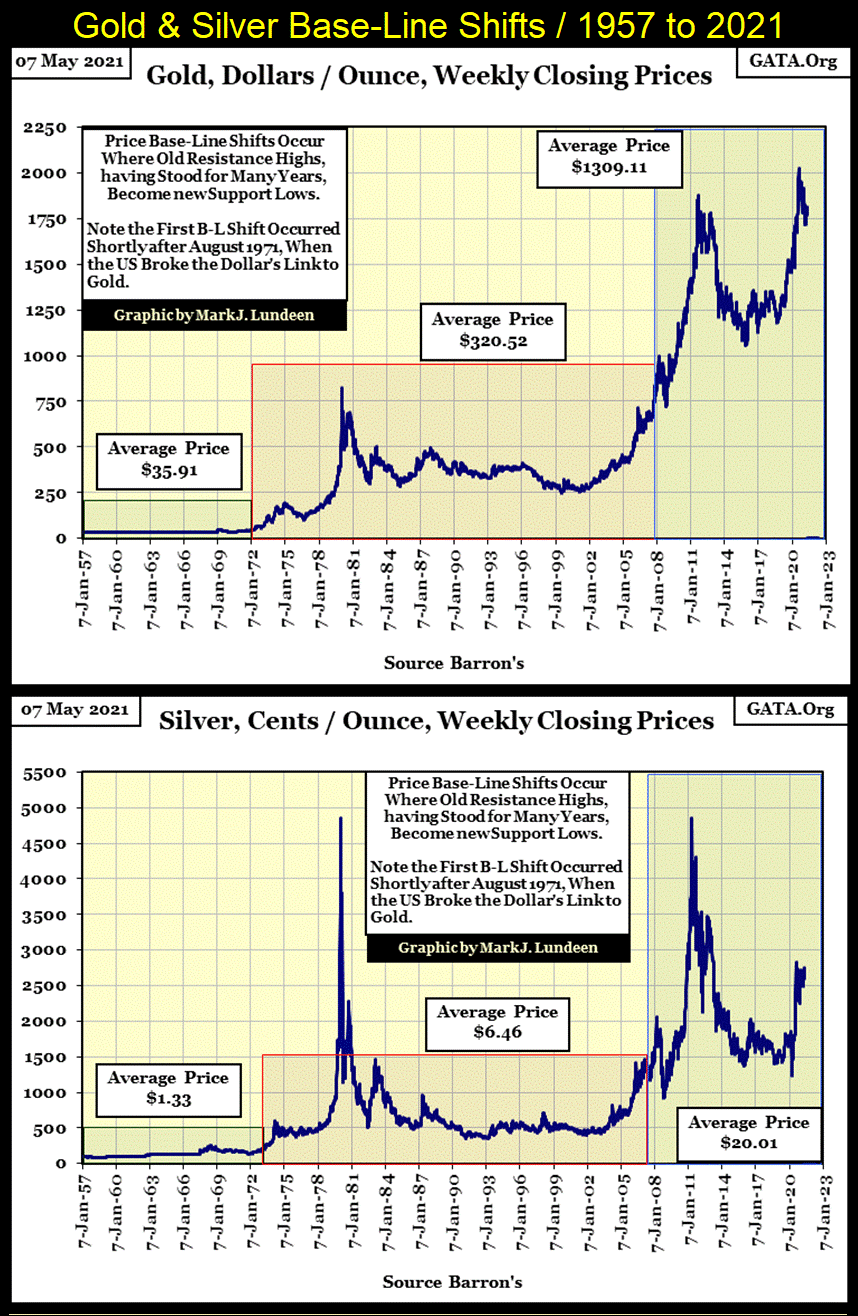
Silver’s last all-time high may still be January 1980, nevertheless it’s obvious the price structure of the silver market has been impacted by the FOMC’s post high-tech bear market “monetary policy”; from 2002 to today. When silver takes out its highs of 1980 & 2011, expect big things in the price of silver.
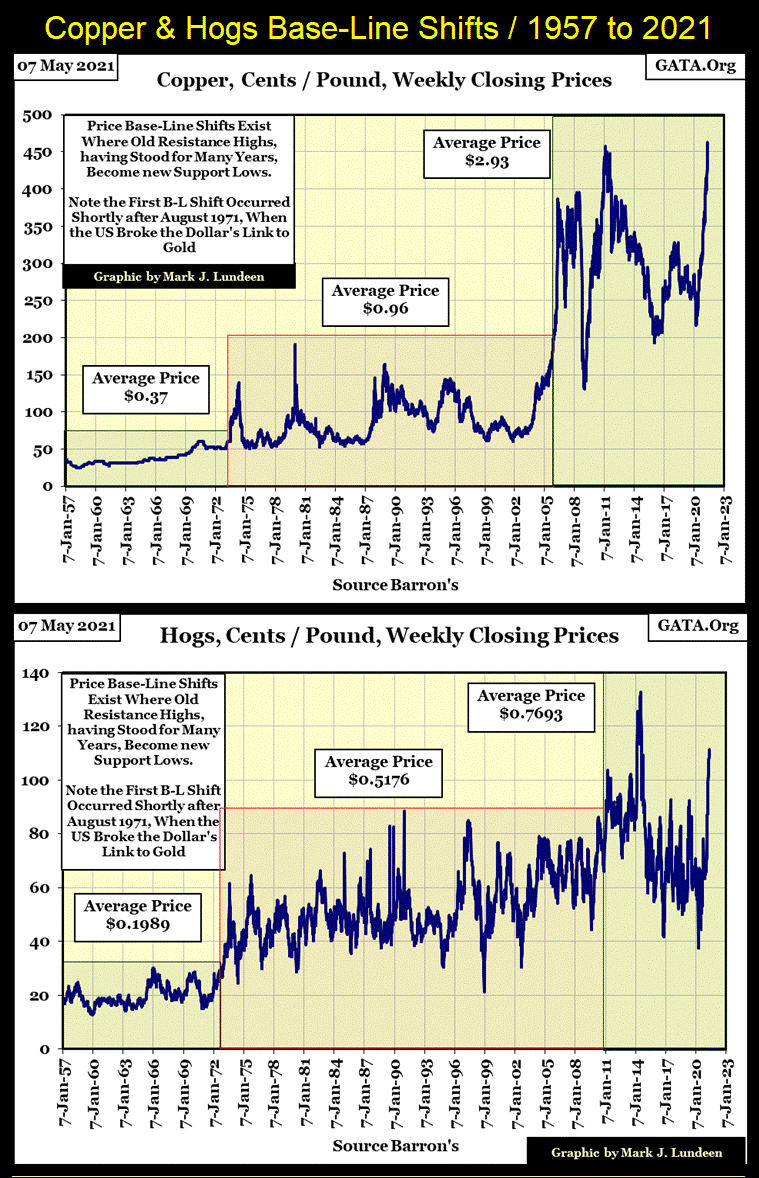
The case for a BL Shift in the hog market may not be made yet. But looking at the advance in hogs since January 2020, I expect a year from now hogs will be selling for well over 140, and not looking back.
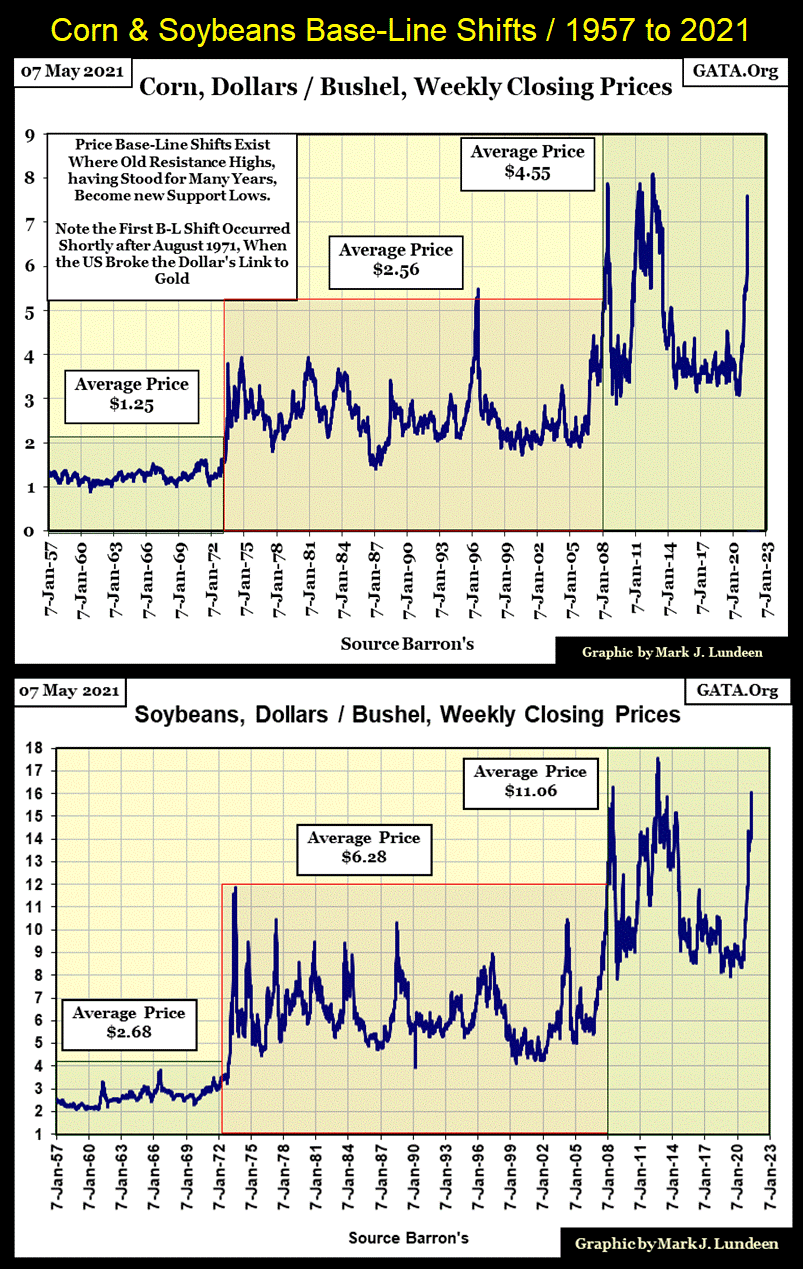
Most of the above markets have yet to break into new all-time highs, but given time they will as “liquidity” flowing from the FOMC can no longer be contained inside the financial markets, but is now also flowing into consumer prices. Why this, if not this week or this month will ultimately prove to be detrimental to the bulls in the stock, bond and real estate markets can be seen below.
As was the case from the late 1950s to 1981 (below), rising bond yields (deflating bond prices) were driven by rising Consumer-Price Inflation (CPI), and the bond market’s reaction to rising CPI was to demand an ever increasing inflation premium.
Bonds are fixed-income instruments, instruments-of-debt that are obligated to payout only so many dollars per year, and no more to their owners. When prospective bond buyers do the math, and see annual consumer-price inflation rates soaring above yields currently offered by the market, they go on a buyer’s strike. They refuse to buy bonds until bond prices are discounted down to a level that will offer them an acceptable current yield that compensates them for CPI inflation losses.
That’s how it should go. But Chairman Powell’s FOMC is now buying corporate bonds to “stabilize” market valuations. Is he willing to allow natural market forces to drive down bond prices to force bond yields higher? We’ll have to wait to see how that changes things in the debt markets.
From 1955 to 1982 below, what we are seeing is the bond market’s reaction to rising CPI inflation; rising yields / deflating prices...
Read Full Story »»»
 DiscoverGold
By: Mark J Lundeen | May 9, 2021
This week the market saw lots of excitement, like the Dow Jones seeing three new BEV Zeros from Wednesday to Friday. These three new all-time highs pushed the Dow Jones up 903 points, or 2.67% above last week’s close.

However, a BEV plot by design underplays advances into record territory. The Dow Jones could have closed above 50,000 this week and its BEV chart above would look no different. So, let’s see what the Dow Jones (Blue Plot) looks like with its 52Wk High (Green Plot) and 52Wk Low (Red Plot) below.
First and foremost, in the chart below we see the effect of monetary inflation flowing from the FOMC has on historical market valuations. The Housing Bubble bear market was the Dow Jones’ second deepest percentage decline (54%) since 1885; impressive! This epic bear market decline induced panic not just in the market, but in Government too.
Still, due to monetary inflation flowing from the FOMC these past thirteen years, inflating the Dow Jones’ valuation by 28,230 points from its 09 March 2008 bottom, the second deepest percentage decline in the Dow Jones seen below doesn’t seem like such a big deal today.

Maybe, when compared to what the pending bear market might look like, (possibly a repeat of the Great Depression’s 90% market deflation), the 2007-09 54% market decline is tame stuff. From this week’s close, a 90% market decline would be a 31,300 point loss for the Dow Jones, the Dow Jones would close at 3,478. So, maybe in the years and decades to come, the Housing Market crash isn’t destined to be a big deal.
Golly gee Mark, you are always too bearish! In my defense, I have to say that inflation from the FOMC isn’t just inflating market valuations, it’s also creating debt burdens on corporate, government and individual balance sheets that are crushing. When the economy enters another recession, which it will, the debt burdens it must carry will amplify its deflationary effects many times, as defaults and bankruptcies bloom like flowers in spring.
How’s that for putting a positive spin on a bad situation!?
Now let’s look at the Bear’s Eye View values for major market indexes I follow in the table below. And for your information, it’s not just the valuation for the Dow Jones that has inflated greatly from their March 2009 bottoms. Looking at these market indexes’ BEV values we don’t get a clue of that. Still this week we saw lots of new all-time highs (BEV Zeros) in the table below.
I also note the XAU (Gold & Silver Mining) is about to break above its BEV -30% line, something not seen since January 2013. In a good market, a market that saw gold and silver bullion making big strides towards their all-time highs, the XAU could be at new all-time highs by August. That’s not a prediction, just a comment on the potential for the mining shares in the months to come.

When we look at these market indexes’ gains off their 23 March 2020 lows in the table above (left side), the XAU is already at #6 in the list. Silver is #12, and gold remains tail-end Charlie at #22.
These double- and triple-digit percentage advances in the stock market since March 2020 are amazing. But then the Federal Reserve has expanded its balance sheet by 88% since February 2020 too. Market valuations have benefitted from this. The alarming thing about the FOMC’s current bout of inflation is to be seen in the table above (right side) listing commodity price increases off their March 2020 bottoms.
I go into more detail below, but keep in mind increases in energy prices (#1&2 right-side above) far exceed gains in the stock market, as basic food prices such as grains and meats are all up by double digit percentages. That isn’t just bad for the stock market, but potentially fatal for the bond market too should these trends continue.
The NYSE 52Wk H-L Nets continue to break above my threshold of +300. On Friday the NYSE saw a 52Wk H-L Net of +529 – wow! So, to Mark Lundeen from the bulls on Wall Street – you and your commodity prices can kiss off! We’re running wild and free on Wall Street, and loving it!

As much as we all love seeing Wall Street’s bulls dancing with happy feet, a fuse has been lit in consumer prices. If current trends in commodity prices isn’t reversed, it’s only a matter of time before interest rates and bond yields begin to rise uncontrollably. That will put massive downward pressure on financial market valuations, while the Federal Reserve stands aside, impotent from doing anything to stop Mr Bear.
What fuse is that? As seen below, since 1957 the commodity market is seeing another, the third of its post Bretton Woods’ base-line shifts (BL Shift) developing.
What’s a base-line shift? A BL Shift has occurred when old price resistance levels (high prices that have not been exceeded for years or decades) become new price support levels; low prices the market refuses to fall below.
Take a quick look at the six commodities plotted below, and what happened after:
• August 1971 when the US took the dollar off the Bretton Woods $35 gold peg,
• October 2002 when the “policy makers” decided to reinflate the stock market after the Dot.Com bubble popped, by inflating yet another bubble in the single-family home mortgage market.
Both these “monetary initiatives” resulted in a base-line shift in commodity prices, with the second BL Shift shifting into high gear after 2008 when Dr. Bernanke implemented his QEs. And now, fourteen months after Chairman Powell began his Not QE#4, a “monetary initiative” that “injected” over $1 trillion dollars into the financial system in the single month of April 2020, and $3.34 trillion in total since, price trends in these commodities strongly suggest a third BL Shift is currently developing.

Silver’s last all-time high may still be January 1980, nevertheless it’s obvious the price structure of the silver market has been impacted by the FOMC’s post high-tech bear market “monetary policy”; from 2002 to today. When silver takes out its highs of 1980 & 2011, expect big things in the price of silver.

The case for a BL Shift in the hog market may not be made yet. But looking at the advance in hogs since January 2020, I expect a year from now hogs will be selling for well over 140, and not looking back.

Most of the above markets have yet to break into new all-time highs, but given time they will as “liquidity” flowing from the FOMC can no longer be contained inside the financial markets, but is now also flowing into consumer prices. Why this, if not this week or this month will ultimately prove to be detrimental to the bulls in the stock, bond and real estate markets can be seen below.
As was the case from the late 1950s to 1981 (below), rising bond yields (deflating bond prices) were driven by rising Consumer-Price Inflation (CPI), and the bond market’s reaction to rising CPI was to demand an ever increasing inflation premium.
Bonds are fixed-income instruments, instruments-of-debt that are obligated to payout only so many dollars per year, and no more to their owners. When prospective bond buyers do the math, and see annual consumer-price inflation rates soaring above yields currently offered by the market, they go on a buyer’s strike. They refuse to buy bonds until bond prices are discounted down to a level that will offer them an acceptable current yield that compensates them for CPI inflation losses.
That’s how it should go. But Chairman Powell’s FOMC is now buying corporate bonds to “stabilize” market valuations. Is he willing to allow natural market forces to drive down bond prices to force bond yields higher? We’ll have to wait to see how that changes things in the debt markets.
From 1955 to 1982 below, what we are seeing is the bond market’s reaction to rising CPI inflation; rising yields / deflating prices...
Read Full Story »»»
 DiscoverGold
Information posted to this board is not meant to suggest any specific action, but to point out the technical signs that can help our readers make their own specific decisions. Caveat emptor!
• DiscoverGold
Join the InvestorsHub Community
Register for free to join our community of investors and share your ideas. You will also get access to streaming quotes, interactive charts, trades, portfolio, live options flow and more tools.


