


| Followers | 680 |
| Posts | 141209 |
| Boards Moderated | 36 |
| Alias Born | 03/10/2004 |
Sunday, April 11, 2021 2:41:44 PM
By: Jim Curry | April 11, 2021
Last week's trading saw gold forming its low in Monday's session, here doing so with the tag of the 1721.60 figure. From there, strength was seen into later in the week, with the metal pushing all the way up to a Thursday high of 1759.40 - before backing off the same into Friday's session.
Gold Market, Short-Term
For the very short-term, the recent rally came, in part, as a result of the upturn in the 10 and 20-day cycles in gold. Here again is the smaller 10-day wave:
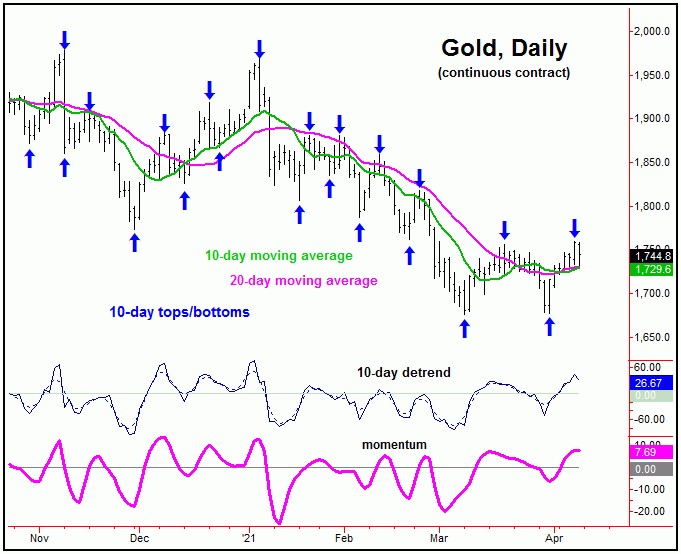
Normally, a cycle will revert back to a moving average of the same length approximately 85-90% of the time, and with that - following the sharp rally seen into late last week - Gold was due for a short-term pullback, coming from this same 10-day component. In terms of price, Friday's action saw the metal dropping right back to our 10-day moving average, with the next short-term bottom expected to come from this 10-day wave.
In terms of patterns, due to the newly-viewed configuration of the larger 72-day cycle, the downward phase of the 10-day cycle is expected to end up as a countertrend affair - holding above the prior 10-day trough of 1677.30.
The chart below shows our 72-day wave:
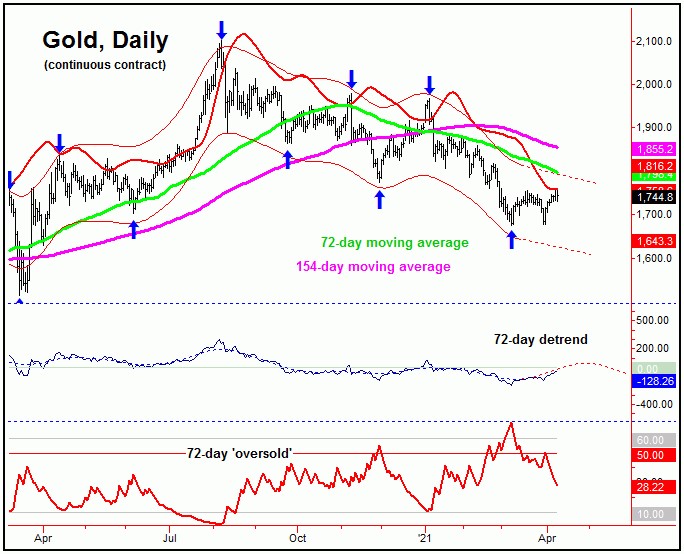
In terms of price, with the recent action, we have our best indication that the 72-day cycle bottomed back in early-March - and with that is headed higher in the coming days/weeks. In terms of price, the ideal path is looking for a rally back to the 72-day moving average or higher, currently around the 1798 figure (but declining).
Stepping back, however, until proven otherwise, the probabilities will favor the next upward phase of the 72-day cycle to end up as a countertrend affair - holding below the prior 72-day peak of 1968.80 - registered back in January. Resistance to that move looks to be centered around the 154 and 310-day moving averages - a range which encompasses the low-to-mid 1800's for gold.
If the upward phase of the 72-day wave does end up as countertrend, then the probabilities will favor another decline phase into the month of May, one which sees either some re-test of the recent lows - or else makes a marginal new low for the bigger swing. Should the latter materialize on a good technical contraction, it should set the metal up for what is expected to be the largest percentage rally of this year.
The chart below shows our Mid-Term Breadth index for the gold market:
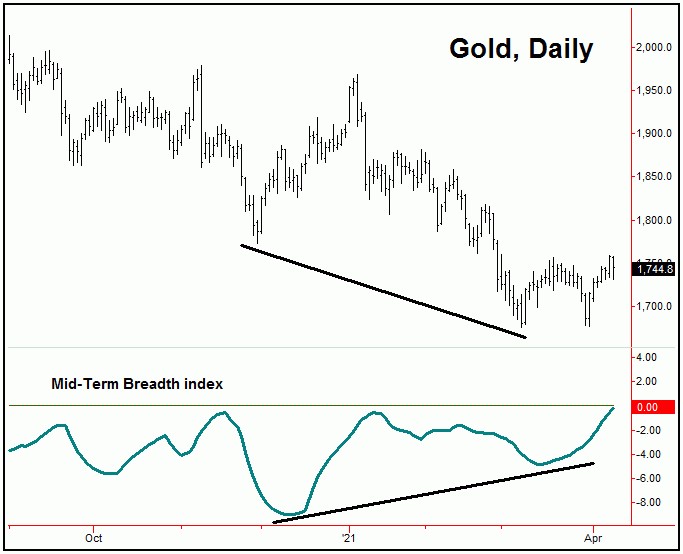
As mentioned in prior articles, at the early-March low this indicator was showing a divergence from price - with gold making new lows for the swing, but the indicator holding well above the prior (November) bottom. This was viewed as bullish - and supportive of additional short-term strength, some of which we have obviously seen over the past month.
A secondary note in regards to the above is that our Mid-Term Breadth index is nearing its 'zero' line. A move above the same in the coming days - should it be seen - is often accompanied by a sharp price rally, which is right in line with our analysis of the 72-day time cycle.
Take a look at the next chart:
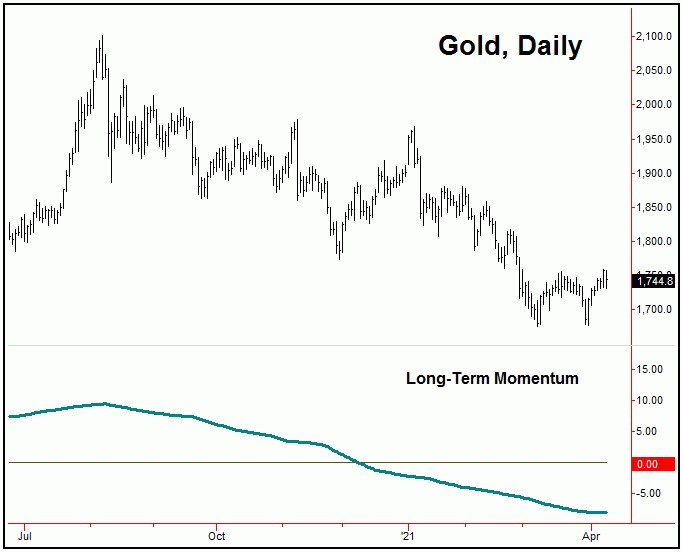
The chart above shows a long-term momentum indicator that I have developed. Of note is that the indicator is starting to flatten out with the action seen in recent weeks - and looks to be closing in on a turn back to the upside. A turn higher in this indicator - if seen going forward - would be an added indication that the metal is turning, for what is favored to be a pretty good rally in the coming weeks.
Gold's Mid-Term Outlook
For the mid-term picture, the next low of significance is expected to come from the 310-day cycle, with the same currently projected for the mid-May timeframe:
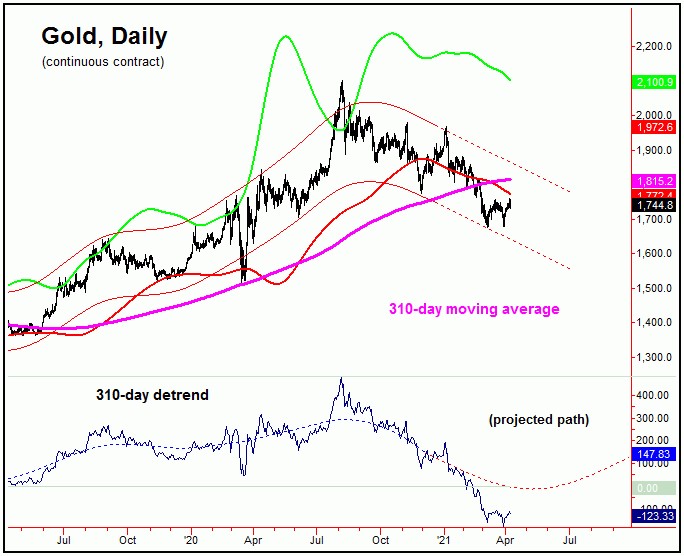
Having said the above, due to the larger plus or minus variance with this 310-day cycle (which can be plus or minus a month or two in either direction), there is the potential its bottom could have already formed - or that it could come slightly later, such as into the month of June.
Going further with the above, a turn in our long-term momentum indicator - should that materialize - would be our first 'hint' that the larger 310-day cycle is turning. We would need to see other technical indications as well, but this is one that we will be watching going forward, as the action plays out in real-time. Stay tuned.
Read Full Story »»»
 DiscoverGold
Information posted to this board is not meant to suggest any specific action, but to point out the technical signs that can help our readers make their own specific decisions. Caveat emptor!
• DiscoverGold
Recent GOLD News
- Barrick Announces Extensive Exploration Partnership with Geophysx Jamaica • GlobeNewswire Inc. • 05/01/2024 10:15:00 AM
- Barrick to Ramp Up Production As It Remains On Track to Achieve 2024 Targets • GlobeNewswire Inc. • 05/01/2024 10:00:00 AM
- Barrick Declares Q1 Dividend • GlobeNewswire Inc. • 05/01/2024 09:59:00 AM
- Barrick Announces Election of Directors • GlobeNewswire Inc. • 04/30/2024 08:15:55 PM
- Barrick On Track to Achieve 2024 Targets • GlobeNewswire Inc. • 04/16/2024 11:00:00 AM
- Notice of Release of Barrick’s First Quarter 2024 Results • GlobeNewswire Inc. • 04/09/2024 11:00:00 AM
- Strategy-Driven Barrick Builds on Value Foundation • GlobeNewswire Inc. • 03/28/2024 09:20:38 PM
- Barrick Hunts New Gold and Copper Prospects in DRC From Kibali Base • GlobeNewswire Inc. • 03/20/2024 02:00:00 PM
- Barrick Opens Academy at Closed Buzwagi Mine • GlobeNewswire Inc. • 03/18/2024 08:00:00 AM
- Barrick to Grow Production and Value on Global Asset Foundation • GlobeNewswire Inc. • 03/15/2024 11:53:01 AM
- Loulo-Gounkoto Delivers Another Value-Creating Performance • GlobeNewswire Inc. • 03/10/2024 10:00:00 AM
- Passing of the Right Honorable Brian Mulroney • GlobeNewswire Inc. • 03/02/2024 01:17:35 AM
- Kibali and DRC Partner to Promote Local Content • GlobeNewswire Inc. • 03/01/2024 02:22:43 PM
- Tanzanian Parliamentary Committee Lauds Barrick’s Work at North Mara • GlobeNewswire Inc. • 02/23/2024 12:00:00 PM
- Form 6-K - Report of foreign issuer [Rules 13a-16 and 15d-16] • Edgar (US Regulatory) • 02/14/2024 10:28:08 PM
- Form 6-K - Report of foreign issuer [Rules 13a-16 and 15d-16] • Edgar (US Regulatory) • 02/14/2024 08:05:25 PM
- Clear Strategies and Strong Partnerships Set Barrick Up to Outperform, Says Bristow • GlobeNewswire Inc. • 02/14/2024 11:00:00 AM
- Barrick Announces New Share Buyback Program • GlobeNewswire Inc. • 02/14/2024 10:59:00 AM
- Barrick Declares Q4 Dividend • GlobeNewswire Inc. • 02/14/2024 10:58:00 AM
- NGM Strongly Positioned for Growth • GlobeNewswire Inc. • 02/10/2024 01:00:16 AM
- Form SC 13G - Statement of acquisition of beneficial ownership by individuals • Edgar (US Regulatory) • 02/08/2024 03:03:08 PM
- Form 6-K - Report of foreign issuer [Rules 13a-16 and 15d-16] • Edgar (US Regulatory) • 02/08/2024 12:46:55 PM
- Geologically Driven Asset Management Delivers Barrick’s Third Successive Year of Reserve Growth at Sustained Quality, While Unlocking Embedded Growth Portfolio • GlobeNewswire Inc. • 02/08/2024 12:00:00 PM
- Form SC 13G/A - Statement of acquisition of beneficial ownership by individuals: [Amend] • Edgar (US Regulatory) • 02/01/2024 06:04:56 PM
- Africa’s Largest Gold Mine Now Also One of Its Greenest • GlobeNewswire Inc. • 01/29/2024 04:00:00 PM
Avant Technologies Equipping AI-Managed Data Center with High Performance Computing Systems • AVAI • May 10, 2024 8:00 AM
VAYK Discloses Strategic Conversation on Potential Acquisition of $4 Million Home Service Business • VAYK • May 9, 2024 9:00 AM
Bantec's Howco Awarded $4.19 Million Dollar U.S. Department of Defense Contract • BANT • May 8, 2024 10:00 AM
Element79 Gold Corp Successfully Closes Maverick Springs Option Agreement • ELEM • May 8, 2024 9:05 AM
Kona Gold Beverages, Inc. Achieves April Revenues Exceeding $586,000 • KGKG • May 8, 2024 8:30 AM
Epazz plans to spin off Galaxy Batteries Inc. • EPAZ • May 8, 2024 7:05 AM

