


| Followers | 680 |
| Posts | 141194 |
| Boards Moderated | 36 |
| Alias Born | 03/10/2004 |
Sunday, March 07, 2021 8:19:50 PM
By: Clive Maund | March 7, 2021
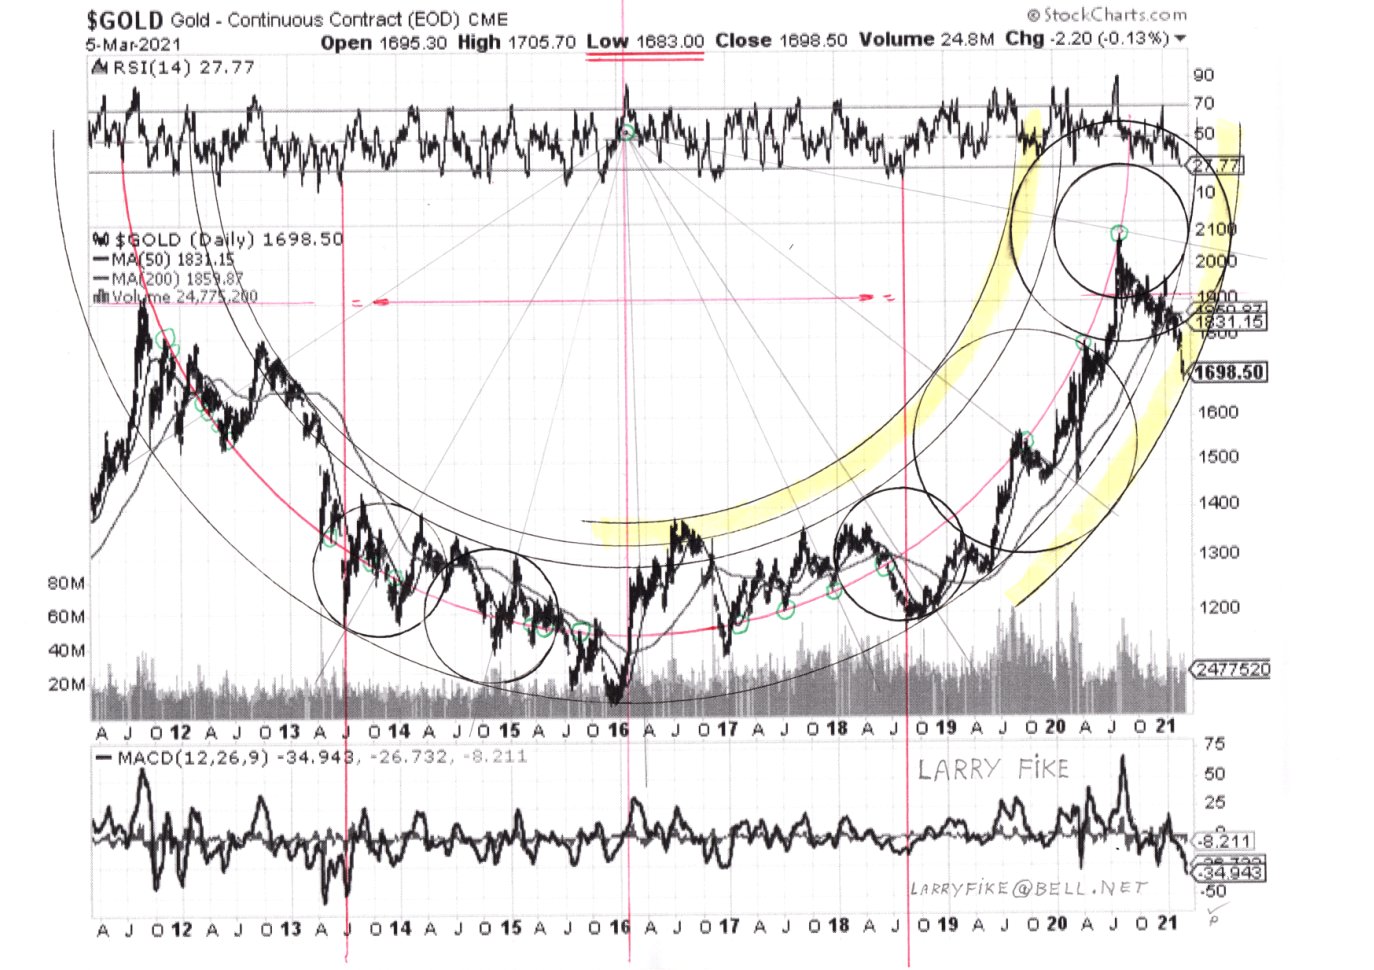
We start this update with the latest version of Larry’s amazing gold chart. As Larry states…
“Gold touched $1683.00 on Friday.
Real close to touching the phantom outside possibility line.
To me this means the final moment of truth should be revealed in the next week.
Huge watershed movement – one way or the other – is about to happen.”
From the action in gold and across markets on Friday, I believe that gold will reverse to the upside this coming week. What happened on Friday is that, with the markets starting to look really fragile, the Bank of America came riding to the rescue saying that the Fed was “going to exercise yield curve control” or words to that effect, meaning that it will attempt to cap shorter-term yields like the 10-year. Every time since 2008 that the markets have looked like they were going to completely cave in, either the Fed has thrown open the monetary spigots or markets have been bolstered by such rhetoric. Anyway it certainly did the trick and we had a big reversal, with bullish reversal candlesticks appearing all over the place, including in many of our stocks.
A point worth making with respect to Larry’s gold chart is that even if gold were to breach the outermost boundary of the giant Bowl pattern, what Larry refers to as the “phantom outside possibility line”, it may simply mean that a “Handle” is about to form that would complement the Bowl, making it a giant Cup & Handle pattern. As investors in the sector we would rather not see that as if the Handle that formed was proportional to the Cup, it could drag on for anything from 6 to 18 months. However if f gold takes off higher immediately, as looks likely, the move could be really big.
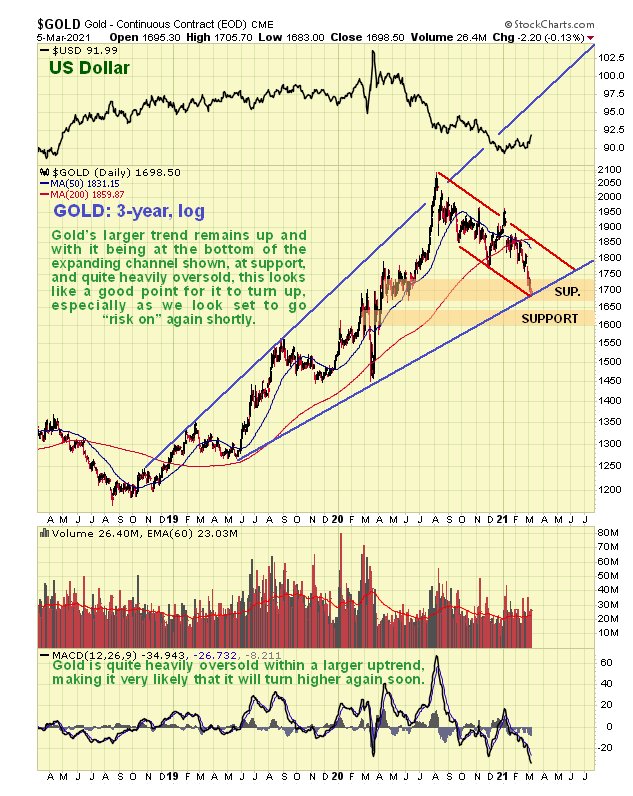
On the 3-year chart we can see gold has reacted all the way back across an expanding channel and now looks like a trading buy for a rally, especially as it is oversold and at an important support level. Bearing in mind what we observed above with respect to it possibly making the Handle of a Cup & Handle pattern, one possibility is that it rallies back up to near the highs of last August and then runs off sideways in a Rectangular pattern bounded by roughly between where it is now and the highs.
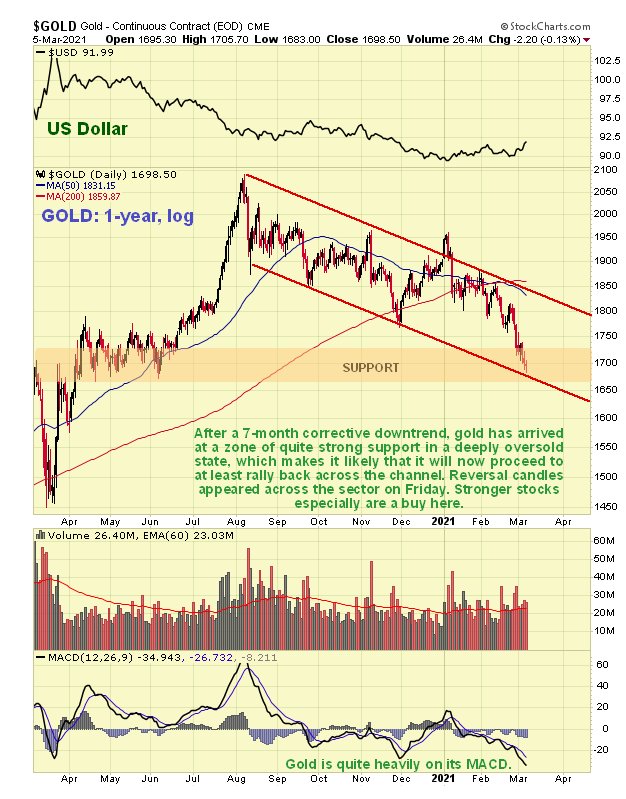
On the 1-year chart we see that not only is gold at the bottom of the expanding channel that we observed on the 3-year chart, it is also at the bottom of the downtrend channel in force from last August, which is double reason for it to turn higher here, quadruple if you factor in that it is significantly oversold and at strong support.
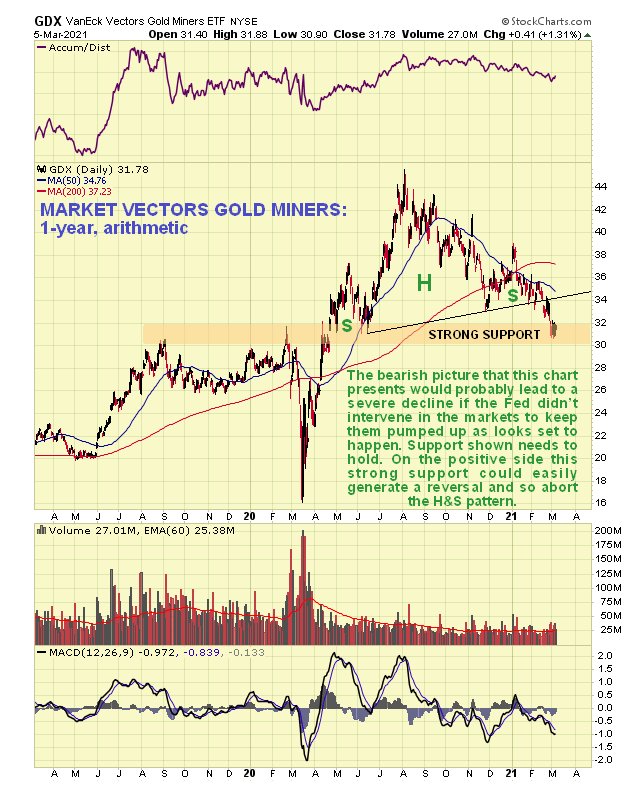
Whilst we know that charts admit of any and all possibilities, and that gold’s chart doesn’t look too bad, the GDX chart is more concerning as it shows that this ETF may have already broken down from a large Head-and-Shoulders top which if valid will project it down towards the lows of March last year. For this to happen the broad stockmarket would probably have to go into “risk off” mode and tank, and that doesn’t look likely in the foreseeable future given what happened in the markets on Friday. So there is considered to be a fair chance that this potential H&S top pattern will abort.
The market doesn’t care about the economy, that much is already obvious – all is cares about is abundant cheap money, and it threw a tantrum last week because the US Treasury 10-year Yield started to rise to levels that are now becoming concerning, as we can see on the 1-year chart for the 10-year Yield below…
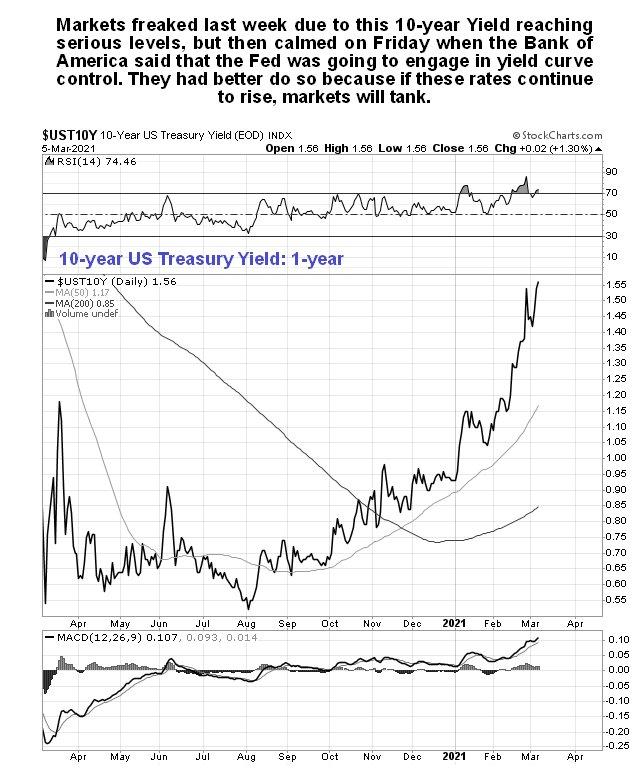
If the 10-year Yield continues any higher it is likely to trigger a much more severe risk-off selloff, so how do stock indices look?
The Dow Jones Industrials doesn’t give a clear indication, nor would you expect it to given that it is a narrow index, and you can only just about make out what’s going on on the S&P500 index, but the index that really gives the game away is the broad Wilshire 5000 Index. On the 6-month chart for this index we can see that upside momentum (MACD) has been fizzling for months, and also that a potential Head-and-Shoulders top is forming, with a line of important support of about 39,200. Thus, if this index drops below 39,000 it could really tank. The Fed therefore needs to pull out all the stops to prevent this happening, which if past performance is prologue, it will do.
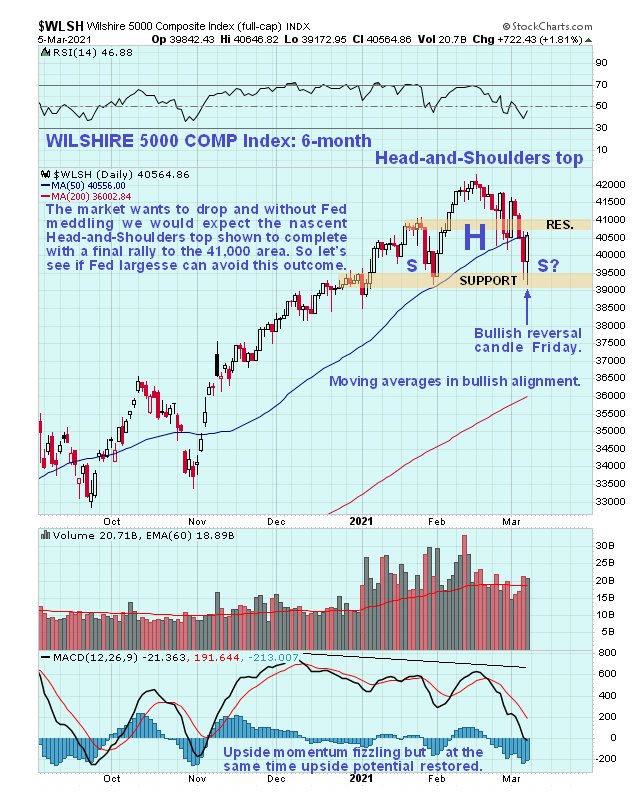
Fortunately, it looks like we have a bit of time – there was reversal candle on Friday in this index, in other indices and in many stocks which implies that another rally is starting, but the danger is that this rally might only be a rally to mark out a symmetrical Right Shoulder to complete the potential Head-and-Shoulders top. So we need to see if the Wilshire can drive through the resistance approaching the highs, especially the resistance at the Left Shoulder of the potential H&S top which is at about 41,000. If it does and the Fed “delivers the goods” meaning more liquidity, then markets could be “off to the races” again, which this time should be better for the Precious Metals sector than thus far.
Read Full Story »»»
 DiscoverGold
Information posted to this board is not meant to suggest any specific action, but to point out the technical signs that can help our readers make their own specific decisions. Caveat emptor!
• DiscoverGold
Recent GDX News
- YieldMax GDXY Name Change • GlobeNewswire Inc. • 01/25/2024 04:22:00 PM
- Surging S&P 500 Breadth • ValueWalk • 07/19/2023 03:16:37 PM
- S&P 500 Corrects In Breadth • ValueWalk • 07/18/2023 03:08:49 PM
- If The USDX Fell So Much, Why Didn’t Gold Truly Soar? • ValueWalk • 07/17/2023 05:16:20 PM
- USD’s Decline That’s… Bearish For Gold?! • ValueWalk • 07/12/2023 02:38:08 PM
- S&P 500 Late Day Reversal Worry • ValueWalk • 07/10/2023 03:17:34 PM
- Massive Gaming Celebrates Global Launch of House of Blackjack with USDC Earning Race • ValueWalk • 07/10/2023 02:44:17 PM
- Breathers In Mining Stocks Are Not Real Rallies • ValueWalk • 07/06/2023 05:20:55 PM
- S&P 500 Character Changes • ValueWalk • 07/06/2023 03:10:06 PM
- S&P 500 – As Bullish As It Gets • ValueWalk • 07/03/2023 04:01:21 PM
- The Great Gold Migration: How Asia Is Dominating The Global Gold Landscape • ValueWalk • 06/30/2023 05:07:35 PM
- S&P 500 Dip Buying And Tame PCE • ValueWalk • 06/30/2023 03:34:13 PM
- The Bullish Reversal In Gold Is Coming • ValueWalk • 06/29/2023 04:00:44 PM
- Insufficient S&P 500 Rotations • ValueWalk • 06/27/2023 02:41:42 PM
- Failing S&P 500 Rotations • ValueWalk • 06/23/2023 03:09:19 PM
- Countdown to S&P 500 Downleg • ValueWalk • 06/19/2023 01:49:20 PM
- Now THAT Was The Game-Changer For The Price Of Gold! • ValueWalk • 06/15/2023 04:40:35 PM
- S&P 500 Manages To Recover Initial Decline • ValueWalk • 06/15/2023 03:30:07 PM
- S&P 500 Manages To Recover From Tech-Driven Decline • ValueWalk • 06/15/2023 03:30:07 PM
- S&P 500 Withstands The Initial Selling – No Hike Tomorrow • ValueWalk • 06/13/2023 03:15:19 PM
- Roadmap For Mining Stocks – Courtesy Of The Stock Market • ValueWalk • 06/06/2023 03:17:49 PM
- Stocks To Still Extend S&P 500 Upswing • ValueWalk • 06/05/2023 03:31:02 PM
- AI, Stocks, And Gold Stocks – Connected After All • ValueWalk • 05/31/2023 03:29:15 PM
- Could Gold Miners Finally Stop Sliding?! • ValueWalk • 05/26/2023 08:42:37 PM
- S&P 500 Fine Selling Initiative • ValueWalk • 05/24/2023 03:06:00 PM
Avant Technologies Equipping AI-Managed Data Center with High Performance Computing Systems • AVAI • May 10, 2024 8:00 AM
VAYK Discloses Strategic Conversation on Potential Acquisition of $4 Million Home Service Business • VAYK • May 9, 2024 9:00 AM
Bantec's Howco Awarded $4.19 Million Dollar U.S. Department of Defense Contract • BANT • May 8, 2024 10:00 AM
Element79 Gold Corp Successfully Closes Maverick Springs Option Agreement • ELEM • May 8, 2024 9:05 AM
Kona Gold Beverages, Inc. Achieves April Revenues Exceeding $586,000 • KGKG • May 8, 2024 8:30 AM
Epazz plans to spin off Galaxy Batteries Inc. • EPAZ • May 8, 2024 7:05 AM

