


| Followers | 689 |
| Posts | 143817 |
| Boards Moderated | 35 |
| Alias Born | 03/10/2004 |
Friday, November 13, 2020 4:02:35 PM
By: Tim Ord | November 11, 2020
* (Click Read Full Story »»» at the bottom of the page for the charts to appear on the post)
SPX Monitoring purposes: Long SPX 10/22/20 at 3453.49.
Monitoring purposes GOLD: Long GDX on 10/9/20 at 40.78.
Long Term SPX monitor purposes: Long SPX on 10/26/20 at 3400.97.
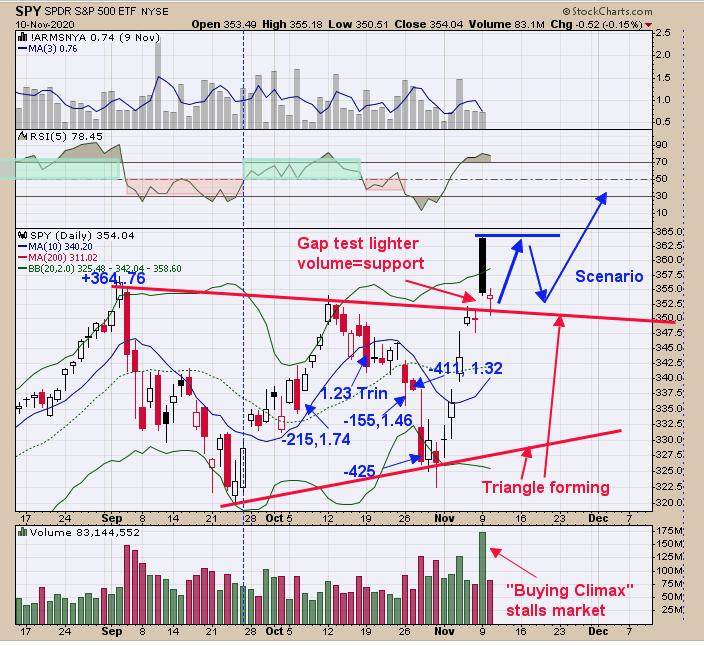
Volume exploded yesterday, which usually stalls the market short-term. Support now comes at yesterday's low if tested on lighter volume, which is the case. Resistance is now yesterday's high if tested on lighter volume, which most likely will be the case and market may then fall back to support. This potential trading range could flow into Thanksgiving, which is about two weeks away. Intermediate-term trend is up but a trading range is developing over the short term. Will remain long for now.

Yesterday we pointed out the "Zweig Breath Thrust" (Zweig formula and named after). Above is the 10-day 2/1 breadth thrust (middle window) for the SPX. This breadth thrust reached bullish levels in mid-October, suggesting an intermediate-term rally is forthcoming. The bottom window is the percent of stocks above their 50-day average. A reading above 70% suggests the market is in a strong position - the current reading is 76.35%. When the stocks above their 50-day average do not exceed 70% (noted in light pink), declines can occur.

Yesterday, we said "[w]eekly GDX has been in a consolidation since early August and it appears this consolidation is near ending, in that the weekly Bollinger bands are starting to 'Pinch.' The 'pinch' is also occurring on the weekly GDX/GLD. The 'pinching' suggests a large move is not far off for both indexes. It appears an impulse wave may be starting here or very soon." Added to the above, that weekly GDX is testing last week's candle low and the weekly GDX/GLD ratio is near the middle of last week's candle, showing that GDX is stronger than GLD. In bullish moves in GDX; GDX outperformed GLD, and that is what is happening on the weekly charts. Long GDX on 10/9/20 at 40.78.
Tim Ord,
Editor
Read Full Story »»»
 DiscoverGold
Information posted to this board is not meant to suggest any specific action, but to point out the technical signs that can help our readers make their own specific decisions. Caveat emptor!
• DiscoverGold
Recent GOLD News
- Porgera Mine Working with UN and Enga Provincial Government to Provide Humanitarian Aid to Violence-Stricken Province • GlobeNewswire Inc. • 09/20/2024 03:35:21 PM
- Barrick Continues to Unlock Value Embedded in Its Asset Base • GlobeNewswire Inc. • 09/17/2024 05:00:29 PM
- Feasibility Study on Lumwana Super Pit Expansion Expected by Year-End • GlobeNewswire Inc. • 09/11/2024 09:00:00 PM
- Key Projects Advance as Barrick Keeps Tight Focus on Value Creation and Growth • GlobeNewswire Inc. • 08/12/2024 10:00:00 AM
- Barrick Declares Q2 Dividend and Buys Back Shares • GlobeNewswire Inc. • 08/12/2024 09:59:00 AM
- U.S. Futures Steady as Markets Await Key Inflation Data, Oil Prices Climb • IH Market News • 08/12/2024 09:47:41 AM
- Mining Plays a Vital Role in Advancing the UN’s Sustainable Development Goals, says Barrick • GlobeNewswire Inc. • 08/02/2024 06:45:39 PM
- Porgera Remains On Track Despite Mulitaka Landslide Challenges • GlobeNewswire Inc. • 07/25/2024 11:00:00 AM
- Higher Q2 Production Puts Barrick On Track to Deliver 2024 Targets • GlobeNewswire Inc. • 07/16/2024 11:00:00 AM
- Barrick Continues to Invest in Mali • GlobeNewswire Inc. • 07/09/2024 07:00:00 PM
- Exploration Success, Capital Investment and Reserve Growth to Sustain Kibali’s Production Profile • GlobeNewswire Inc. • 07/02/2024 04:00:00 PM
- Barrick and Zijin Contribute $1 Million to Support Papua New Guinea Landslide Victims • GlobeNewswire Inc. • 06/07/2024 11:18:39 AM
- Form SD - Specialized disclosure report • Edgar (US Regulatory) • 05/29/2024 08:01:04 PM
- Barrick’s Sustainability Strategy Delivers Real Value to Stakeholders • GlobeNewswire Inc. • 05/15/2024 11:00:00 AM
- Barrick Announces Extensive Exploration Partnership with Geophysx Jamaica • GlobeNewswire Inc. • 05/01/2024 10:15:00 AM
- Barrick to Ramp Up Production As It Remains On Track to Achieve 2024 Targets • GlobeNewswire Inc. • 05/01/2024 10:00:00 AM
- Barrick Declares Q1 Dividend • GlobeNewswire Inc. • 05/01/2024 09:59:00 AM
- Barrick Announces Election of Directors • GlobeNewswire Inc. • 04/30/2024 08:15:55 PM
- Barrick On Track to Achieve 2024 Targets • GlobeNewswire Inc. • 04/16/2024 11:00:00 AM
- Notice of Release of Barrick’s First Quarter 2024 Results • GlobeNewswire Inc. • 04/09/2024 11:00:00 AM
- Strategy-Driven Barrick Builds on Value Foundation • GlobeNewswire Inc. • 03/28/2024 09:20:38 PM
- Barrick Hunts New Gold and Copper Prospects in DRC From Kibali Base • GlobeNewswire Inc. • 03/20/2024 02:00:00 PM
- Barrick Opens Academy at Closed Buzwagi Mine • GlobeNewswire Inc. • 03/18/2024 08:00:00 AM
- Barrick to Grow Production and Value on Global Asset Foundation • GlobeNewswire Inc. • 03/15/2024 11:53:01 AM
- Loulo-Gounkoto Delivers Another Value-Creating Performance • GlobeNewswire Inc. • 03/10/2024 10:00:00 AM
Lingerie Fighting Championships Signs Broadcast Deal With Maybacks Global Entertainment • BOTY • Sep 26, 2024 9:00 AM
Maybacks Global Entertainment and Lingerie Fighting Championships Enter Into Broadcast And Revenue Sharing Agreement • AHRO • Sep 26, 2024 8:30 AM
North Bay Resources Commences Operations at Bishop Gold Mill, Inyo County, California; Engages Sabean Group Management Consulting • NBRI • Sep 25, 2024 9:15 AM
CEO David B. Dorwart Anticipates a Bright Future at Good Gaming Inc. Through His Most Recent Shareholder Update • GMER • Sep 25, 2024 8:30 AM
Cannabix Technologies and Omega Laboratories Inc. Advance Marijuana Breathalyzer Technology - Dr. Bruce Goldberger to Present at Society of Forensic Toxicologists Conference • BLOZF • Sep 24, 2024 8:50 AM
Integrated Ventures, Inc Announces Strategic Partnership For GLP-1 (Semaglutide) Procurement Through MedWell USA, LLC. • INTV • Sep 24, 2024 8:45 AM

