


| Followers | 689 |
| Posts | 143817 |
| Boards Moderated | 35 |
| Alias Born | 03/10/2004 |
Monday, February 03, 2020 8:15:59 PM
By: David Keller | February 3, 2020
* (Click Read Full Story »»» at the bottom of the page for the charts to appear on the post)
With stock markets in rapid decline this week, mindful investors should be looking around for opportunities. What asset classes are thriving while others are struggling?
A quick survey of the asset allocation will indicate that, while oil has been in freefall and stocks are now testing and failing at support, gold and bonds have rallied nicely.
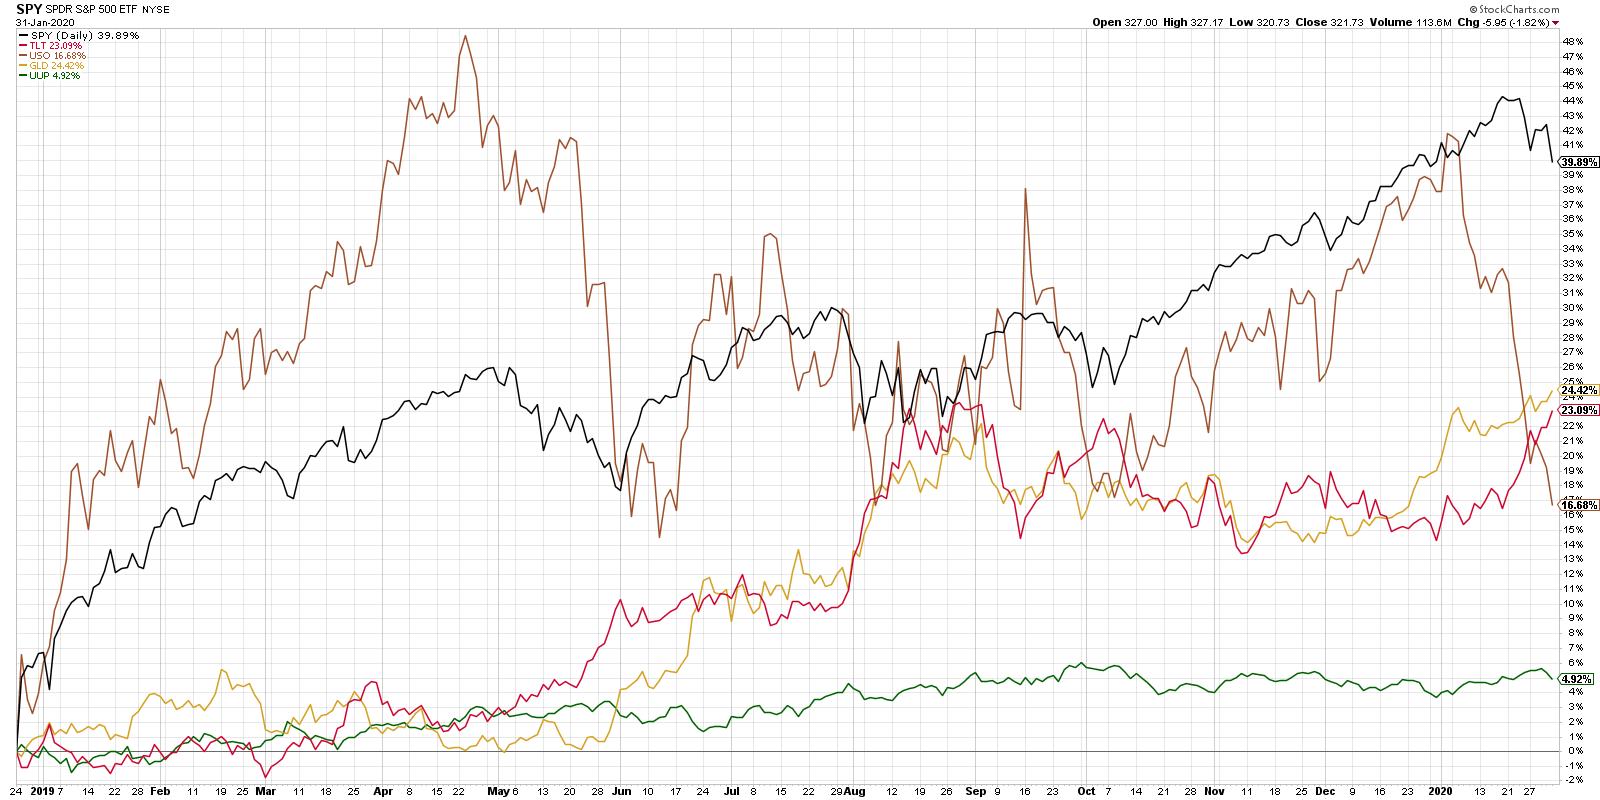
Now, if you start the clock at the December 2018 market low, stocks still appear to be the long-term winners, which is absolutely correct. A shorter-term view, however, shows how the movements of the last month relate to the previous year.
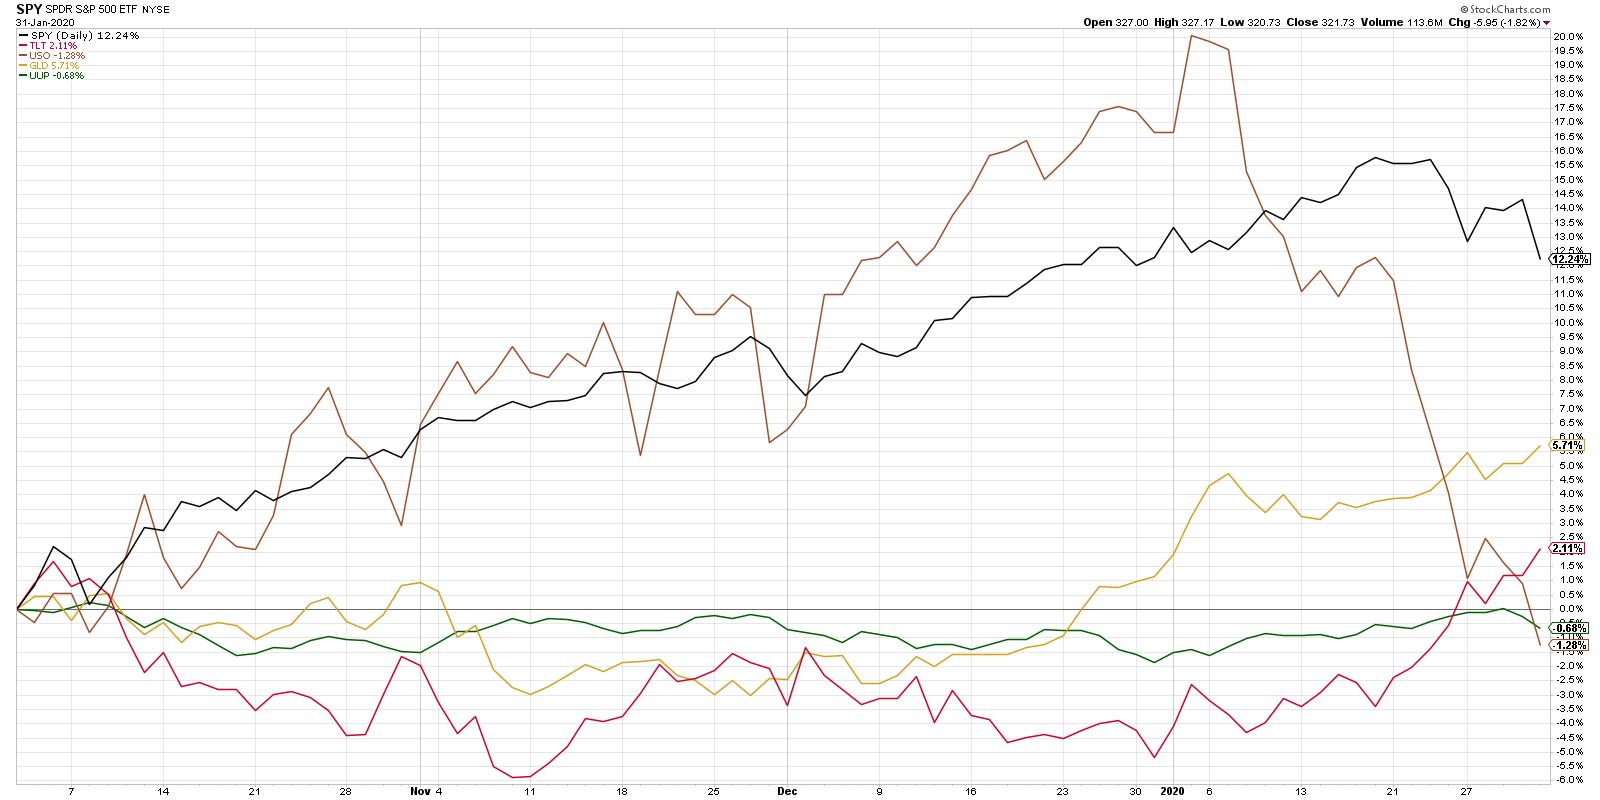
With this view, we can see the last month in much better detail, including the topping pattern of stocks and the break to new swing lows this week. We also can see both the GLD and the TLT breaking to new closing highs at the same time.
When you dig deeper into the gold story from a technical perspective, one of the first things you should recognize is the difference in return profiles between equities and gold. To put it another way, equities and gold just tend to move in very different ways.
One way to visualize these relative movements is through a correlation chart:
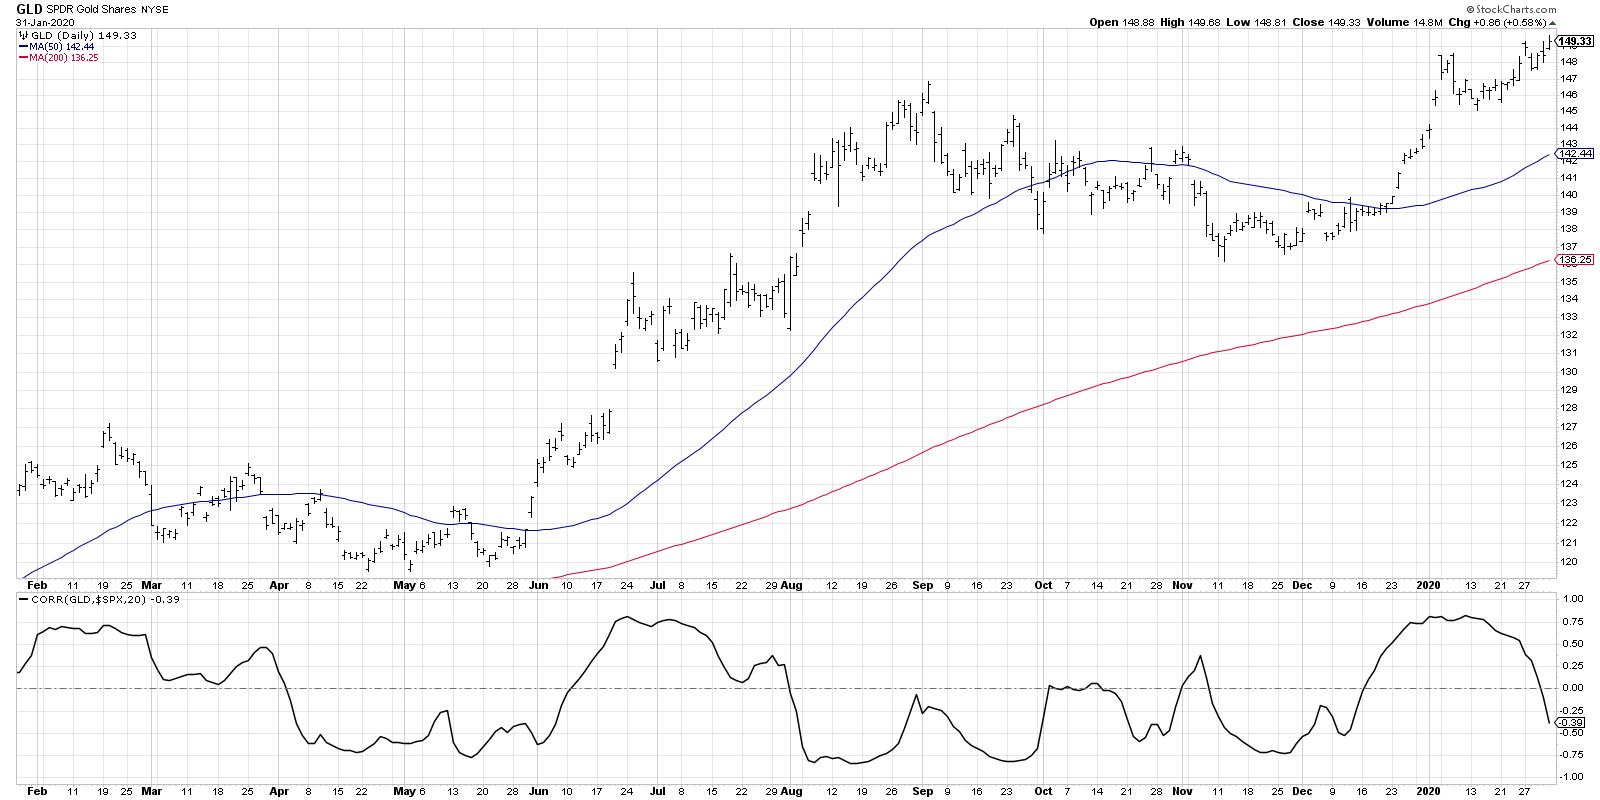
Here, we're showing the gold ETF along with a rolling 20-day correlation to the S&P 500. Many investors think that stocks and gold are inversely correlated, meaning that when stocks do well, gold starts to suffer (and vice versa).
The data actually shows that this is not a consistent phenomenon. There are periods (such as mid-January) where they have moved together. In this case, both gold and stocks were in steady uptrends. However, there are other periods, such as August 2019, where they moved inversely to one another. In that instance, gold rallied while stocks were in mid-summer correction mode.
Long story short, gold and stocks have diversified return streams. This means that, for investors looking to diversify their exposure to price trends, a position in gold could provide some of that.
What are the charts saying about the overall trend in gold here?
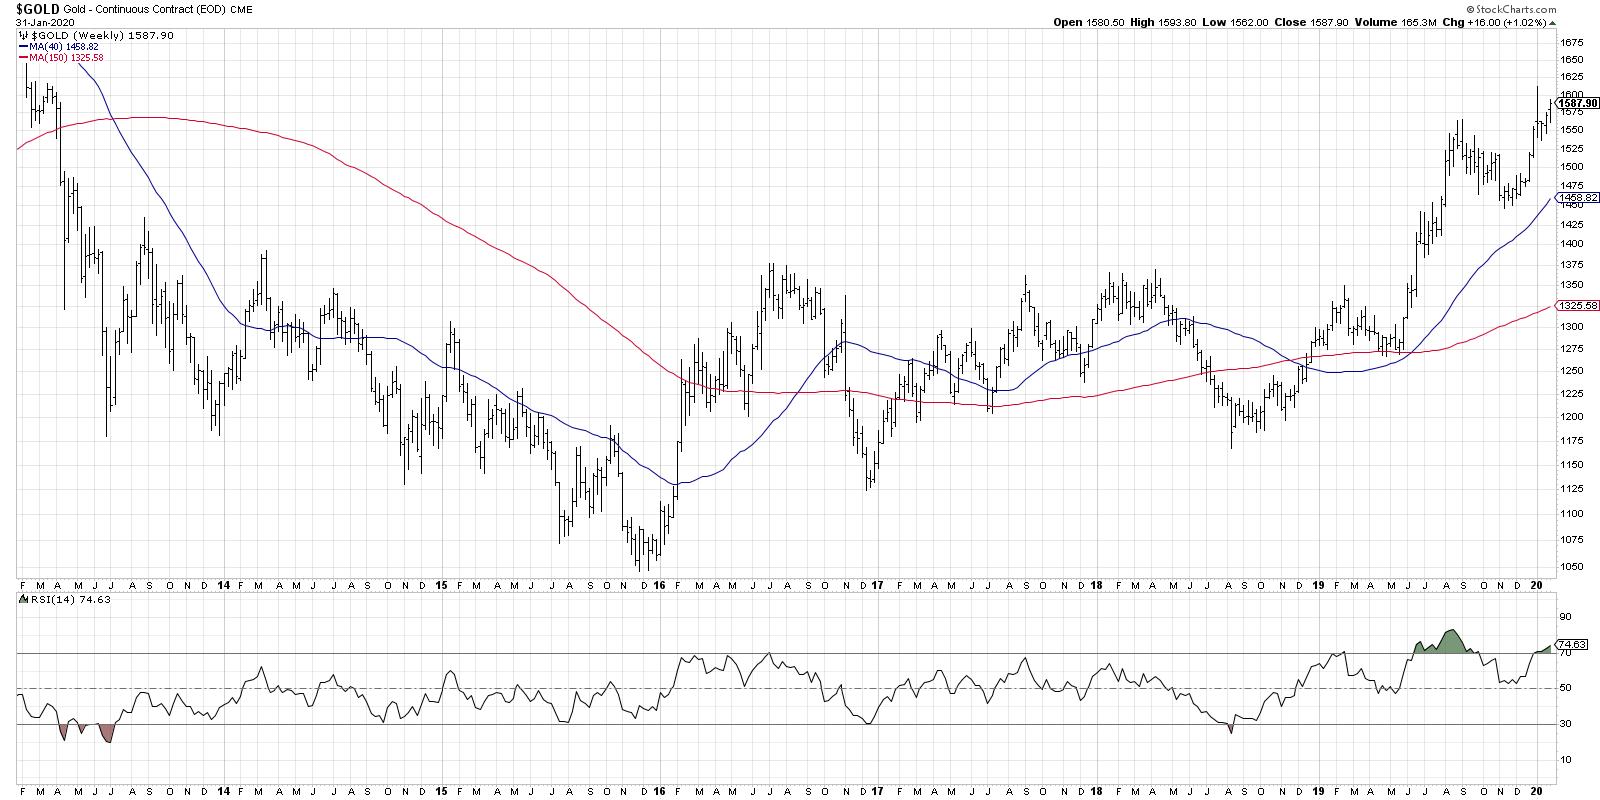
The weekly chart of the gold future illustrates the long-term rotation from downtrend to sideways trend to uptrend. In mid-2019, gold broke above a significant resistance level. "The bigger the base, the higher in space!" as my mentor Ralph Acampora would tell me. This suggests much further upside for gold based on the amount of time spent in consolidation mode.
The daily chart of the GLD shows how the current chart relates to the first half of 2019.
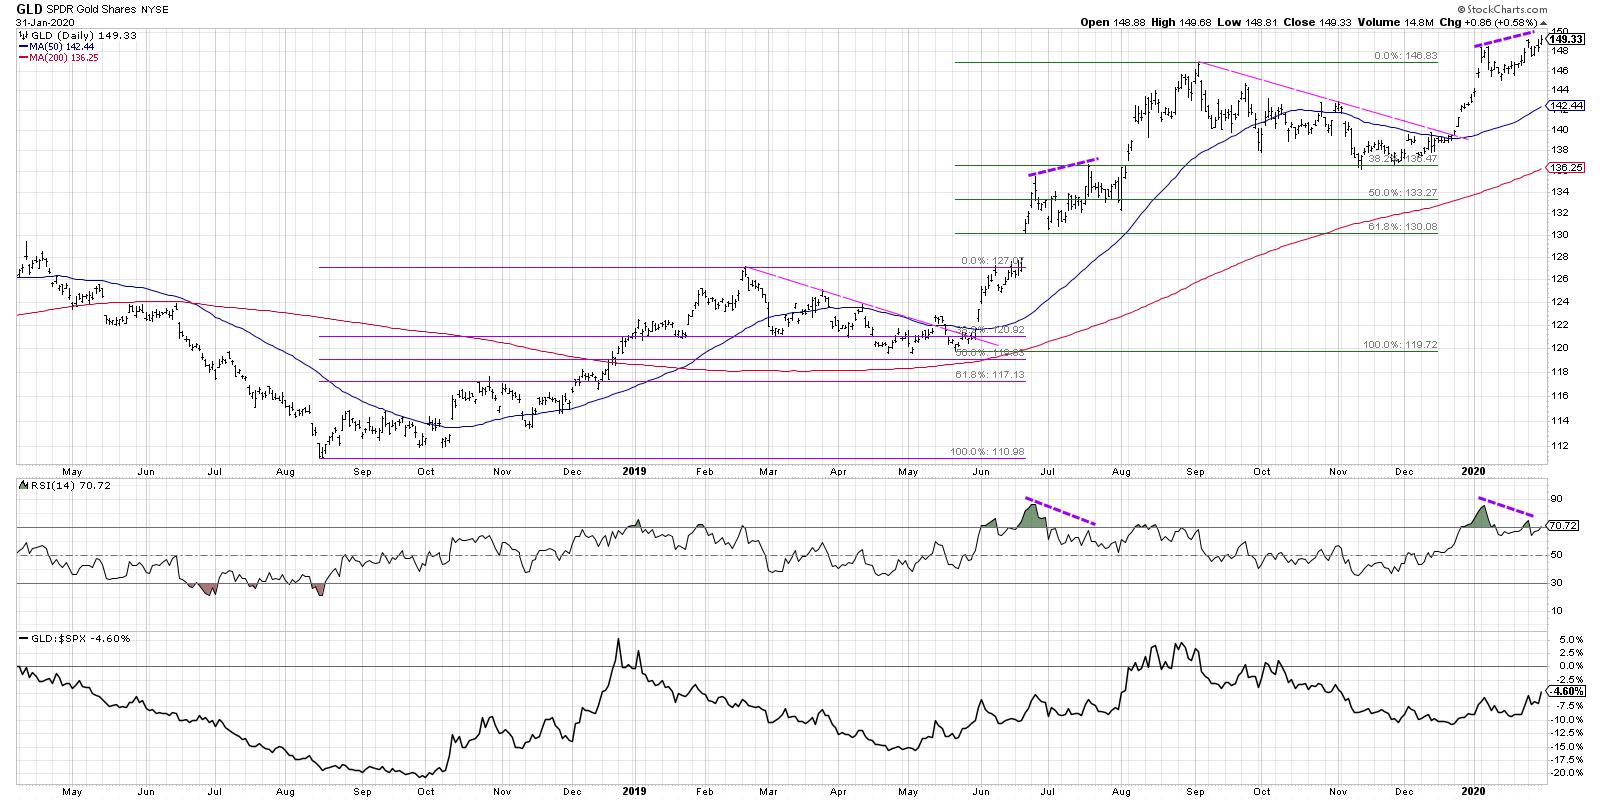
In the first quarter of 2019, gold topped out, then retraced just over 38.2% of the previous uptrend. The GLD then broke back above resistance and continued on to a bearish divergence, with higher price peaks and lower RSI. This bearish divergence actually resolved higher, with the GLD closing above the 137 level in August when stocks were pulling back.
We saw a very similar pattern, with a bullish run followed by a 38.2% pullback, last November. Now, we have the same bullish divergence that we saw in 2019. A confirmed close above the 150 level would complete this pattern that we saw last year, with a bearish divergence indicating more of a pause before the resumption of the long-term uptrend.
Regardless of the future trend in gold, the differentiated return profile from other asset classes suggests it is worth considering as part of a mindful asset allocation exercise.
RR#6,
Dave
Read Full Story »»»
 DiscoverGold
Information posted to this board is not meant to suggest any specific action, but to point out the technical signs that can help our readers make their own specific decisions. Caveat emptor!
• DiscoverGold
Recent GOLD News
- Porgera Mine Working with UN and Enga Provincial Government to Provide Humanitarian Aid to Violence-Stricken Province • GlobeNewswire Inc. • 09/20/2024 03:35:21 PM
- Barrick Continues to Unlock Value Embedded in Its Asset Base • GlobeNewswire Inc. • 09/17/2024 05:00:29 PM
- Feasibility Study on Lumwana Super Pit Expansion Expected by Year-End • GlobeNewswire Inc. • 09/11/2024 09:00:00 PM
- Key Projects Advance as Barrick Keeps Tight Focus on Value Creation and Growth • GlobeNewswire Inc. • 08/12/2024 10:00:00 AM
- Barrick Declares Q2 Dividend and Buys Back Shares • GlobeNewswire Inc. • 08/12/2024 09:59:00 AM
- U.S. Futures Steady as Markets Await Key Inflation Data, Oil Prices Climb • IH Market News • 08/12/2024 09:47:41 AM
- Mining Plays a Vital Role in Advancing the UN’s Sustainable Development Goals, says Barrick • GlobeNewswire Inc. • 08/02/2024 06:45:39 PM
- Porgera Remains On Track Despite Mulitaka Landslide Challenges • GlobeNewswire Inc. • 07/25/2024 11:00:00 AM
- Higher Q2 Production Puts Barrick On Track to Deliver 2024 Targets • GlobeNewswire Inc. • 07/16/2024 11:00:00 AM
- Barrick Continues to Invest in Mali • GlobeNewswire Inc. • 07/09/2024 07:00:00 PM
- Exploration Success, Capital Investment and Reserve Growth to Sustain Kibali’s Production Profile • GlobeNewswire Inc. • 07/02/2024 04:00:00 PM
- Barrick and Zijin Contribute $1 Million to Support Papua New Guinea Landslide Victims • GlobeNewswire Inc. • 06/07/2024 11:18:39 AM
- Form SD - Specialized disclosure report • Edgar (US Regulatory) • 05/29/2024 08:01:04 PM
- Barrick’s Sustainability Strategy Delivers Real Value to Stakeholders • GlobeNewswire Inc. • 05/15/2024 11:00:00 AM
- Barrick Announces Extensive Exploration Partnership with Geophysx Jamaica • GlobeNewswire Inc. • 05/01/2024 10:15:00 AM
- Barrick to Ramp Up Production As It Remains On Track to Achieve 2024 Targets • GlobeNewswire Inc. • 05/01/2024 10:00:00 AM
- Barrick Declares Q1 Dividend • GlobeNewswire Inc. • 05/01/2024 09:59:00 AM
- Barrick Announces Election of Directors • GlobeNewswire Inc. • 04/30/2024 08:15:55 PM
- Barrick On Track to Achieve 2024 Targets • GlobeNewswire Inc. • 04/16/2024 11:00:00 AM
- Notice of Release of Barrick’s First Quarter 2024 Results • GlobeNewswire Inc. • 04/09/2024 11:00:00 AM
- Strategy-Driven Barrick Builds on Value Foundation • GlobeNewswire Inc. • 03/28/2024 09:20:38 PM
- Barrick Hunts New Gold and Copper Prospects in DRC From Kibali Base • GlobeNewswire Inc. • 03/20/2024 02:00:00 PM
- Barrick Opens Academy at Closed Buzwagi Mine • GlobeNewswire Inc. • 03/18/2024 08:00:00 AM
- Barrick to Grow Production and Value on Global Asset Foundation • GlobeNewswire Inc. • 03/15/2024 11:53:01 AM
- Loulo-Gounkoto Delivers Another Value-Creating Performance • GlobeNewswire Inc. • 03/10/2024 10:00:00 AM
VHAI - Vocodia Partners with Leading Political Super PACs to Revolutionize Fundraising Efforts • VHAI • Sep 19, 2024 11:48 AM
Dear Cashmere Group Holding Co. AKA Swifty Global Signs Binding Letter of Intent to be Acquired by Signing Day Sports • DRCR • Sep 19, 2024 10:26 AM
HealthLynked Launches Virtual Urgent Care Through Partnership with Lyric Health. • HLYK • Sep 19, 2024 8:00 AM
Element79 Gold Corp. Appoints Kevin Arias as Advisor to the Board of Directors, Strengthening Strategic Leadership • ELMGF • Sep 18, 2024 10:29 AM
Mawson Finland Limited Further Expands the Known Mineralized Zones at Rajapalot: Palokas step-out drills 7 metres @ 9.1 g/t gold & 706 ppm cobalt • MFL • Sep 17, 2024 9:02 AM
PickleJar Announces Integration With OptCulture to Deliver Holistic Fan Experiences at Venue Point of Sale • PKLE • Sep 17, 2024 8:00 AM

