


| Followers | 689 |
| Posts | 143817 |
| Boards Moderated | 35 |
| Alias Born | 03/10/2004 |
Saturday, January 25, 2020 8:44:41 AM
By: Erin Swenlin | January 24, 2020
* (Click Read Full Story »»» at the bottom of the page for the charts to appear on the post)
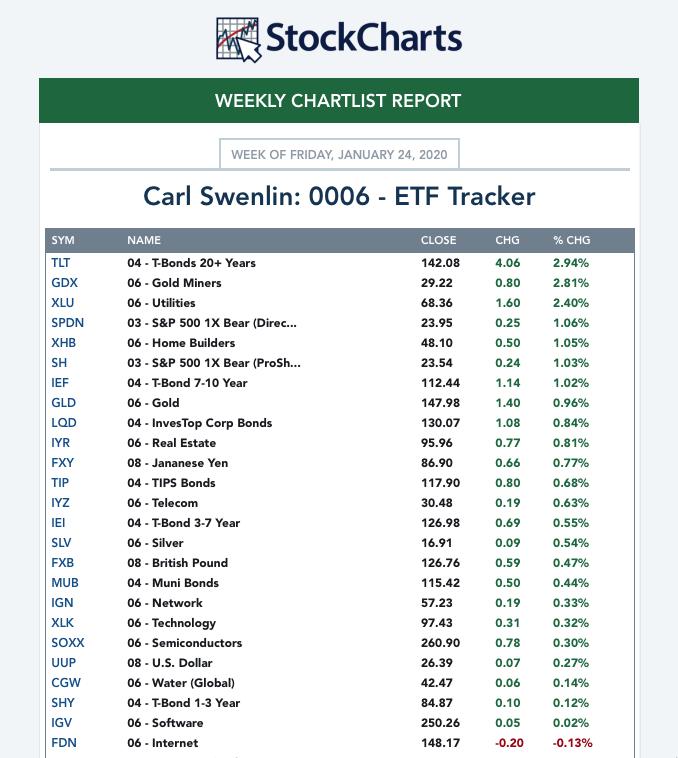
Gold Miners have been on fire this week! Each Friday, I get a Weekly ChartList Report on the ETF Tracker ChartList that Carl and I have developed. If you would like it, you'll find it in the DP Trend and Condition ChartPack (free to Extra members and above!). Nearly every day, I have seen Gold Miners near the top, so it wasn't surprising to see it at the top on the Weekly Report. DecisionPoint has developed a "Golden Cross Index" (GCI) and "Silver Cross Index" (SCI) which tell us how many stocks in those indexes or groups have 50-EMAs above their 200-EMAs (GCI) and how many have 20-EMAs above their 50-EMAs. We have the GCI and SCI for Gold Miners, so I thought I'd share some extra insight.
Below is the daily chart for GDX, the Gold Miners ETF that we track. The chart shows a textbook "cup and handle" chart pattern. It began to execute this week, with the breakout from the declining tops trend line that is the "handle" of the pattern. The PMO is confirming this breakout as it rises to likely give us a crossover BUY signal. Another plus on the daily chart is the positive divergence between OBV rising bottoms and declining price lows.

We are seeing a pullback on the Silver Cross Index, as well as a drop below the signal line. I find this healthy and appropriate right now, given how overbought this group was. It still is at a healthy reading of 80, meaning 80% of the Gold Miners in this ETF have 20-EMAs above 50-EMAs. Now, as price breaks out from the handle, we do want to see the SCI begin to turn back up to confirm; it isn't right now, which could be a problem if this rally is to be sustained. On the other hand, the Golden Cross Index looks great, albeit overbought. It is rising and, as you can see, since the end of summer it has maintained mostly above 80. Overbought conditions can persist in a bull market rally.

Below is a weekly chart of GDX. Here it looks as though a flag has executed. The big area of overhead resistance lies close, at $31. The weekly PMO has turned up after this week's rally.

Conclusion: Overall, I'd say Gold Miners have the potential to continue higher. The Silver Cross Index is pulling back and overhead resistance is pretty close, but the daily and weekly PMO are confirming and not overbought, the chart pattern is very bullish and I like the positive divergence of the OBV on the daily chart. If you haven't checked out our new website DecisionPoint.com, I invite you to come see it and sign up for our free email newsletter!
Technical Analysis is a windsock, not a crystal ball.
Happy Charting! - Erin
Read Full Story »»»
 DiscoverGold
Information posted to this board is not meant to suggest any specific action, but to point out the technical signs that can help our readers make their own specific decisions. Caveat emptor!
• DiscoverGold
Recent GOLD News
- Porgera Mine Working with UN and Enga Provincial Government to Provide Humanitarian Aid to Violence-Stricken Province • GlobeNewswire Inc. • 09/20/2024 03:35:21 PM
- Barrick Continues to Unlock Value Embedded in Its Asset Base • GlobeNewswire Inc. • 09/17/2024 05:00:29 PM
- Feasibility Study on Lumwana Super Pit Expansion Expected by Year-End • GlobeNewswire Inc. • 09/11/2024 09:00:00 PM
- Key Projects Advance as Barrick Keeps Tight Focus on Value Creation and Growth • GlobeNewswire Inc. • 08/12/2024 10:00:00 AM
- Barrick Declares Q2 Dividend and Buys Back Shares • GlobeNewswire Inc. • 08/12/2024 09:59:00 AM
- U.S. Futures Steady as Markets Await Key Inflation Data, Oil Prices Climb • IH Market News • 08/12/2024 09:47:41 AM
- Mining Plays a Vital Role in Advancing the UN’s Sustainable Development Goals, says Barrick • GlobeNewswire Inc. • 08/02/2024 06:45:39 PM
- Porgera Remains On Track Despite Mulitaka Landslide Challenges • GlobeNewswire Inc. • 07/25/2024 11:00:00 AM
- Higher Q2 Production Puts Barrick On Track to Deliver 2024 Targets • GlobeNewswire Inc. • 07/16/2024 11:00:00 AM
- Barrick Continues to Invest in Mali • GlobeNewswire Inc. • 07/09/2024 07:00:00 PM
- Exploration Success, Capital Investment and Reserve Growth to Sustain Kibali’s Production Profile • GlobeNewswire Inc. • 07/02/2024 04:00:00 PM
- Barrick and Zijin Contribute $1 Million to Support Papua New Guinea Landslide Victims • GlobeNewswire Inc. • 06/07/2024 11:18:39 AM
- Form SD - Specialized disclosure report • Edgar (US Regulatory) • 05/29/2024 08:01:04 PM
- Barrick’s Sustainability Strategy Delivers Real Value to Stakeholders • GlobeNewswire Inc. • 05/15/2024 11:00:00 AM
- Barrick Announces Extensive Exploration Partnership with Geophysx Jamaica • GlobeNewswire Inc. • 05/01/2024 10:15:00 AM
- Barrick to Ramp Up Production As It Remains On Track to Achieve 2024 Targets • GlobeNewswire Inc. • 05/01/2024 10:00:00 AM
- Barrick Declares Q1 Dividend • GlobeNewswire Inc. • 05/01/2024 09:59:00 AM
- Barrick Announces Election of Directors • GlobeNewswire Inc. • 04/30/2024 08:15:55 PM
- Barrick On Track to Achieve 2024 Targets • GlobeNewswire Inc. • 04/16/2024 11:00:00 AM
- Notice of Release of Barrick’s First Quarter 2024 Results • GlobeNewswire Inc. • 04/09/2024 11:00:00 AM
- Strategy-Driven Barrick Builds on Value Foundation • GlobeNewswire Inc. • 03/28/2024 09:20:38 PM
- Barrick Hunts New Gold and Copper Prospects in DRC From Kibali Base • GlobeNewswire Inc. • 03/20/2024 02:00:00 PM
- Barrick Opens Academy at Closed Buzwagi Mine • GlobeNewswire Inc. • 03/18/2024 08:00:00 AM
- Barrick to Grow Production and Value on Global Asset Foundation • GlobeNewswire Inc. • 03/15/2024 11:53:01 AM
- Loulo-Gounkoto Delivers Another Value-Creating Performance • GlobeNewswire Inc. • 03/10/2024 10:00:00 AM
VHAI - Vocodia Partners with Leading Political Super PACs to Revolutionize Fundraising Efforts • VHAI • Sep 19, 2024 11:48 AM
Dear Cashmere Group Holding Co. AKA Swifty Global Signs Binding Letter of Intent to be Acquired by Signing Day Sports • DRCR • Sep 19, 2024 10:26 AM
HealthLynked Launches Virtual Urgent Care Through Partnership with Lyric Health. • HLYK • Sep 19, 2024 8:00 AM
Element79 Gold Corp. Appoints Kevin Arias as Advisor to the Board of Directors, Strengthening Strategic Leadership • ELMGF • Sep 18, 2024 10:29 AM
Mawson Finland Limited Further Expands the Known Mineralized Zones at Rajapalot: Palokas step-out drills 7 metres @ 9.1 g/t gold & 706 ppm cobalt • MFL • Sep 17, 2024 9:02 AM
PickleJar Announces Integration With OptCulture to Deliver Holistic Fan Experiences at Venue Point of Sale • PKLE • Sep 17, 2024 8:00 AM

