


| Followers | 689 |
| Posts | 143817 |
| Boards Moderated | 35 |
| Alias Born | 03/10/2004 |
Sunday, January 12, 2020 9:47:37 AM
By: David Keller | January 11, 2020
* (Click Read Full Story »»» at the bottom of the page for the charts to appear on the post)
The final chart that I shared in my portion of the StockCharts 2020 Market Outlook (coming soon to our YouTube channel!) was a two-year chart of gold. After a pullback in the fall to Fibonacci support, gold appeared to be resuming its long-term uptrend. Later, gold reached an extreme overbought condition, which suggested a brief pullback before a resumption of the uptrend. That pullback has now happened. But is the uptrend now set to resume?
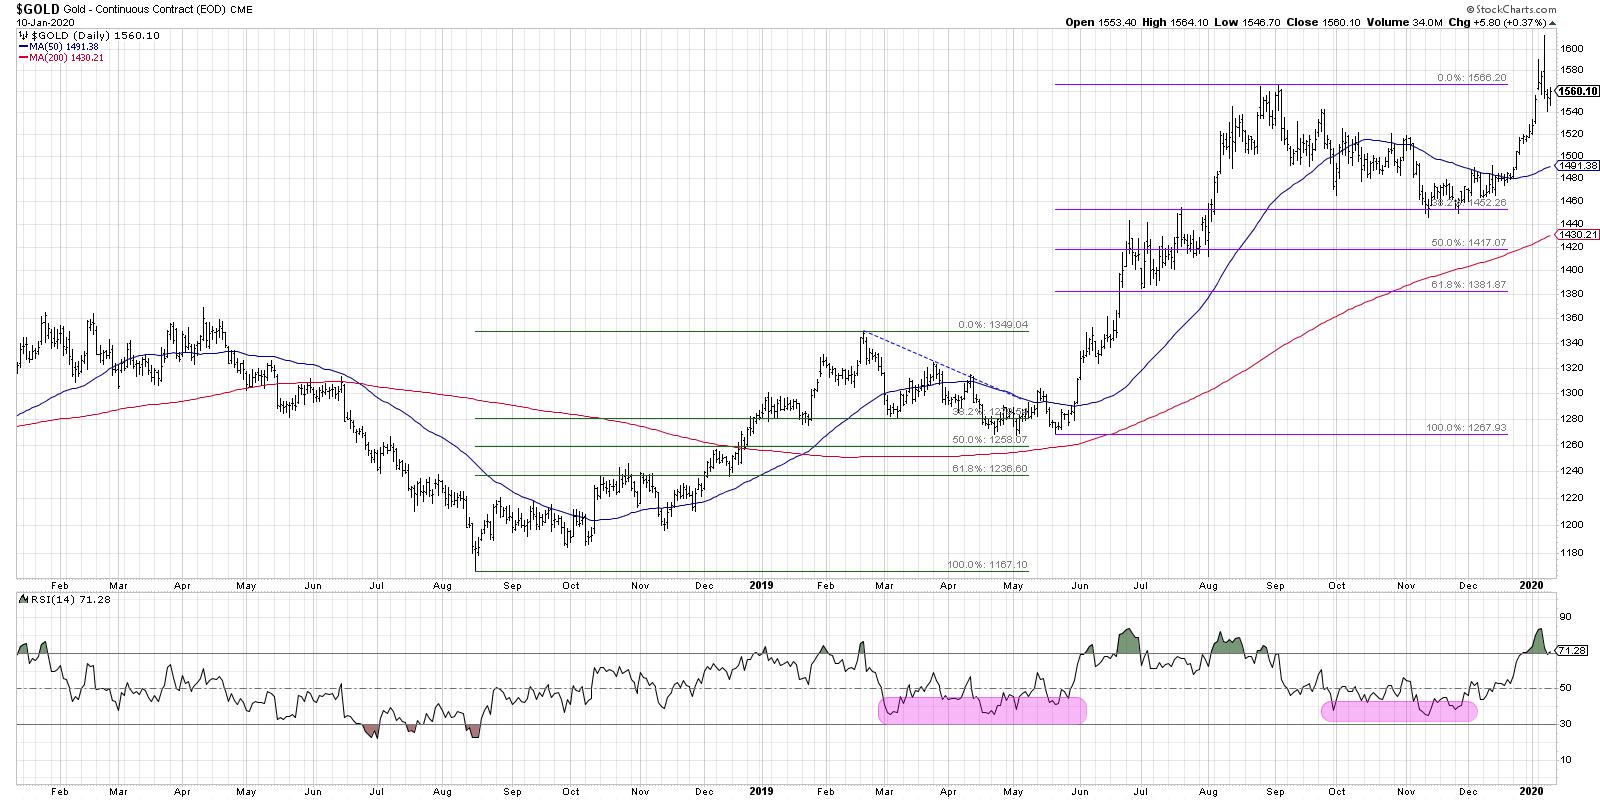
In February 2019, gold reached a short-term peak just below the 1350 level before pulling back to just below the 38.2% Fibonacci level. During this corrective period, the RSI on gold never really went below the 40 level, which often serves as support during bull phases.
After a three-month pullback period, gold resumed its uptrend and broke back above 1350 in June 2019. Soon after, the price rally pushed the RSI to the extreme overbought level above 80.
As I've discussed previously, this usually suggests a short-term pullback before a resumption of the uptrend. To put another way, the upside momentum is so strong that there is usually further upside in store.
Gold again reached an RSI above 80 in early August, but the final price rally in September saw a lower peak in RSI. This resulted in a bearish divergence, with higher highs in price but lower peaks in RSI (suggesting potential downside risk). From that point on, the chart of gold has appeared to repeat this pattern. The selloff last fall saw the RSI reach down to the key 40 level but not much lower. The price also found support at the 38.2% Fibonacci level, similar to mid-2019.
Heading into the new year, gold pushed back toward its previous high around 1566, while RSI has once again became extremely overbought. Akin to what we saw in the previous example, this would suggest a short-term pullback before further upside. The question now is whether it continues to follow the 2019 playbook and resume a long-term uptrend, or if it flounders back in the 1450-1570 range while equities continue their relentless climb to higher highs.
My guess is that the uptrend continues. But shouldn't gold suffer in a bullish equity environment? Not necessarily. While people love to think of gold as a safe haven, there are plenty of times where gold and stocks are positively correlated. The reasons as to why these trends evolve is often quite clear in the rearview mirror. For now, I'm happy following trends, following history and following sentiment!
In my recent interview with Ralph Acampora, he reminded me that the market doesn't always repeat, but it often rhymes. In this case, a review of gold prices in 2019 may be a good roadmap for gold prices in the first quarter of 2020.
RR#6,
Dave
Read Full Story »»»
 DiscoverGold
Information posted to this board is not meant to suggest any specific action, but to point out the technical signs that can help our readers make their own specific decisions. Caveat emptor!
• DiscoverGold
Recent GOLD News
- Barrick Continues to Unlock Value Embedded in Its Asset Base • GlobeNewswire Inc. • 09/17/2024 05:00:29 PM
- Feasibility Study on Lumwana Super Pit Expansion Expected by Year-End • GlobeNewswire Inc. • 09/11/2024 09:00:00 PM
- Key Projects Advance as Barrick Keeps Tight Focus on Value Creation and Growth • GlobeNewswire Inc. • 08/12/2024 10:00:00 AM
- Barrick Declares Q2 Dividend and Buys Back Shares • GlobeNewswire Inc. • 08/12/2024 09:59:00 AM
- U.S. Futures Steady as Markets Await Key Inflation Data, Oil Prices Climb • IH Market News • 08/12/2024 09:47:41 AM
- Mining Plays a Vital Role in Advancing the UN’s Sustainable Development Goals, says Barrick • GlobeNewswire Inc. • 08/02/2024 06:45:39 PM
- Porgera Remains On Track Despite Mulitaka Landslide Challenges • GlobeNewswire Inc. • 07/25/2024 11:00:00 AM
- Higher Q2 Production Puts Barrick On Track to Deliver 2024 Targets • GlobeNewswire Inc. • 07/16/2024 11:00:00 AM
- Barrick Continues to Invest in Mali • GlobeNewswire Inc. • 07/09/2024 07:00:00 PM
- Exploration Success, Capital Investment and Reserve Growth to Sustain Kibali’s Production Profile • GlobeNewswire Inc. • 07/02/2024 04:00:00 PM
- Barrick and Zijin Contribute $1 Million to Support Papua New Guinea Landslide Victims • GlobeNewswire Inc. • 06/07/2024 11:18:39 AM
- Form SD - Specialized disclosure report • Edgar (US Regulatory) • 05/29/2024 08:01:04 PM
- Barrick’s Sustainability Strategy Delivers Real Value to Stakeholders • GlobeNewswire Inc. • 05/15/2024 11:00:00 AM
- Barrick Announces Extensive Exploration Partnership with Geophysx Jamaica • GlobeNewswire Inc. • 05/01/2024 10:15:00 AM
- Barrick to Ramp Up Production As It Remains On Track to Achieve 2024 Targets • GlobeNewswire Inc. • 05/01/2024 10:00:00 AM
- Barrick Declares Q1 Dividend • GlobeNewswire Inc. • 05/01/2024 09:59:00 AM
- Barrick Announces Election of Directors • GlobeNewswire Inc. • 04/30/2024 08:15:55 PM
- Barrick On Track to Achieve 2024 Targets • GlobeNewswire Inc. • 04/16/2024 11:00:00 AM
- Notice of Release of Barrick’s First Quarter 2024 Results • GlobeNewswire Inc. • 04/09/2024 11:00:00 AM
- Strategy-Driven Barrick Builds on Value Foundation • GlobeNewswire Inc. • 03/28/2024 09:20:38 PM
- Barrick Hunts New Gold and Copper Prospects in DRC From Kibali Base • GlobeNewswire Inc. • 03/20/2024 02:00:00 PM
- Barrick Opens Academy at Closed Buzwagi Mine • GlobeNewswire Inc. • 03/18/2024 08:00:00 AM
- Barrick to Grow Production and Value on Global Asset Foundation • GlobeNewswire Inc. • 03/15/2024 11:53:01 AM
- Loulo-Gounkoto Delivers Another Value-Creating Performance • GlobeNewswire Inc. • 03/10/2024 10:00:00 AM
- Passing of the Right Honorable Brian Mulroney • GlobeNewswire Inc. • 03/02/2024 01:17:35 AM
VHAI - Vocodia Partners with Leading Political Super PACs to Revolutionize Fundraising Efforts • VHAI • Sep 19, 2024 11:48 AM
Dear Cashmere Group Holding Co. AKA Swifty Global Signs Binding Letter of Intent to be Acquired by Signing Day Sports • DRCR • Sep 19, 2024 10:26 AM
HealthLynked Launches Virtual Urgent Care Through Partnership with Lyric Health. • HLYK • Sep 19, 2024 8:00 AM
Element79 Gold Corp. Appoints Kevin Arias as Advisor to the Board of Directors, Strengthening Strategic Leadership • ELMGF • Sep 18, 2024 10:29 AM
Mawson Finland Limited Further Expands the Known Mineralized Zones at Rajapalot: Palokas step-out drills 7 metres @ 9.1 g/t gold & 706 ppm cobalt • MFL • Sep 17, 2024 9:02 AM
PickleJar Announces Integration With OptCulture to Deliver Holistic Fan Experiences at Venue Point of Sale • PKLE • Sep 17, 2024 8:00 AM

