The Most Volatile Stocks on Earnings: Q2 2019 By: Bespoke Investment Group | July 9, 2019
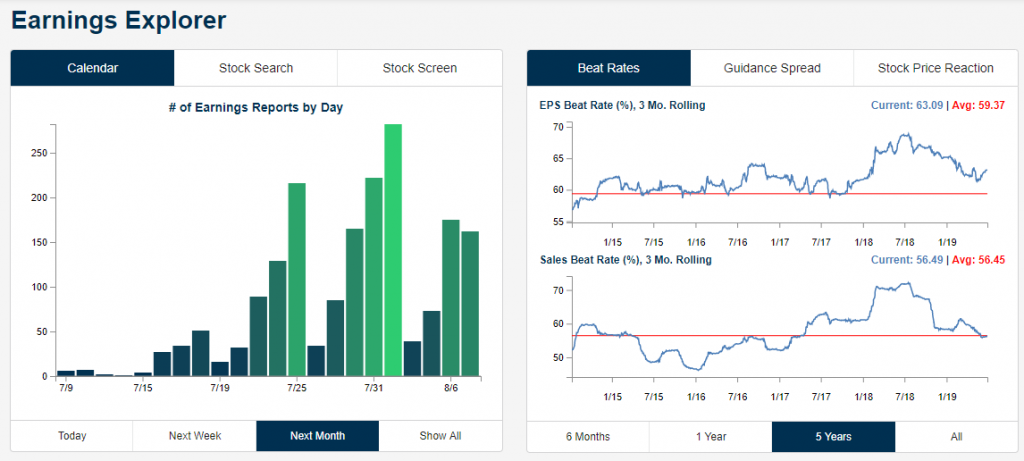
Below is a snapshot from our Earnings Explorer tool showing the number of publicly traded US companies that are set to report earnings over the next month. As shown, things don't pick up until the second half of July and early August.
In terms of beat rates, coming into this earnings season, the rolling 3-month EPS beat rate stands at 63.09%, which is well above the long-term average beat rate of 59.37%. (The beat rate represents the percentage of companies that have beaten consensus analyst EPS estimates over the last 3 months.) The 3-month revenue beat rate is at just 56.49%, however, which is right inline with the historical average.
As we do at the start of each earnings season, below we take a look at the most volatile stocks on earnings. When we look at earnings volatility, we mean how the stock typically moves on the first trading day following its quarterly earnings report. For stocks that report after the close, we're looking at its price change on the next trading day. For stocks that report in the morning before the open, we're looking at its price change on that trading day.
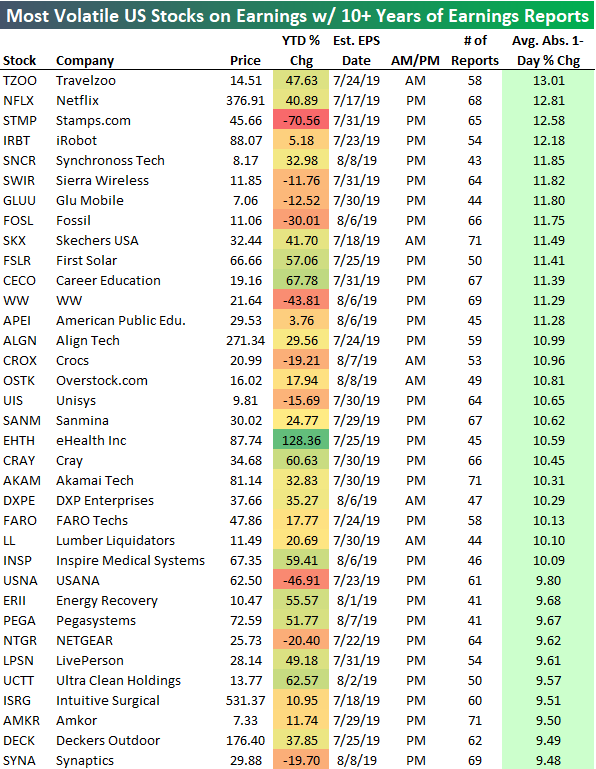
We've been keeping track of earnings reports and price reactions to earnings for 20+ years now, and we have a database accessible to subscribers that lets you pull up historical earnings results for nearly every US company going back to 2001. Using our database, below is a list of the stocks with at least 10 years of quarterly earnings reports (at least 40 reports) that react the most violently to earnings. Each of the stocks listed has historically averaged a move of +/-9.4%+ on its earnings reaction day.
The most volatile stock on earnings with at least 10 years of reports is Travelzoo (TZOO). Over time, the stock has seen an average one-day move of +/-13.01% when it reports earnings. TZOO reports before the open on 7/24 this season. Netflix (NFLX) ranks second with an average one-day move of +/-12.81%, followed by Stamps.com (STMP), iRobot (IRBT), and Synchronoss Tech (SNCR). Other notables on the list of biggest movers include Fossil (FOSL), First Solar (FSLR), Align Tech (ALGN), and Intuitive Surgical (ISRG).
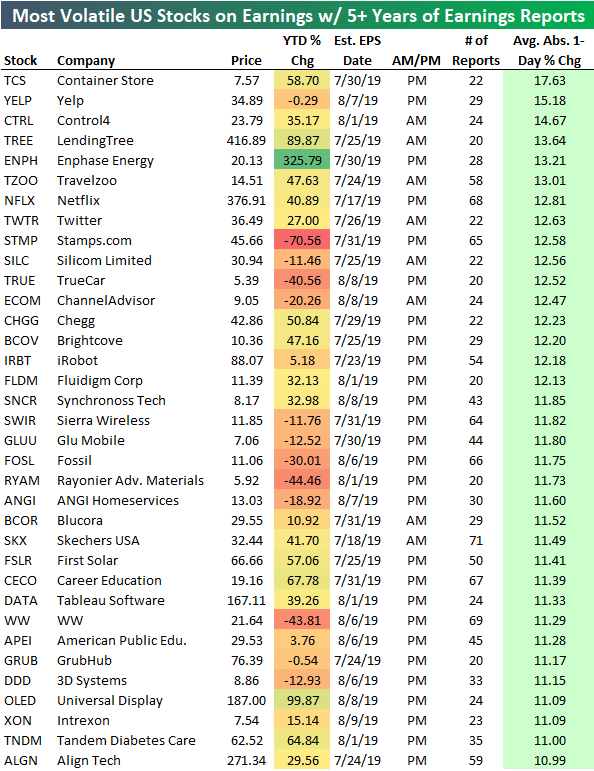
If we include companies that only have 5+ years of quarterly earnings results (20+ quarters), there are stocks with even more volatility. The Container Store (TCS) has 22 quarterly earnings reports, and the stock has averaged a one-day move of +/-17.63% on these days! Yelp (YELP) ranks 2nd with an average move of +/-15.18%, followed by Control4 (CTRL) at +/-14.67%, LendingTree (TREE) at +/-13.64%, and Enphase Energy (ENPH) at +/-13.21%.
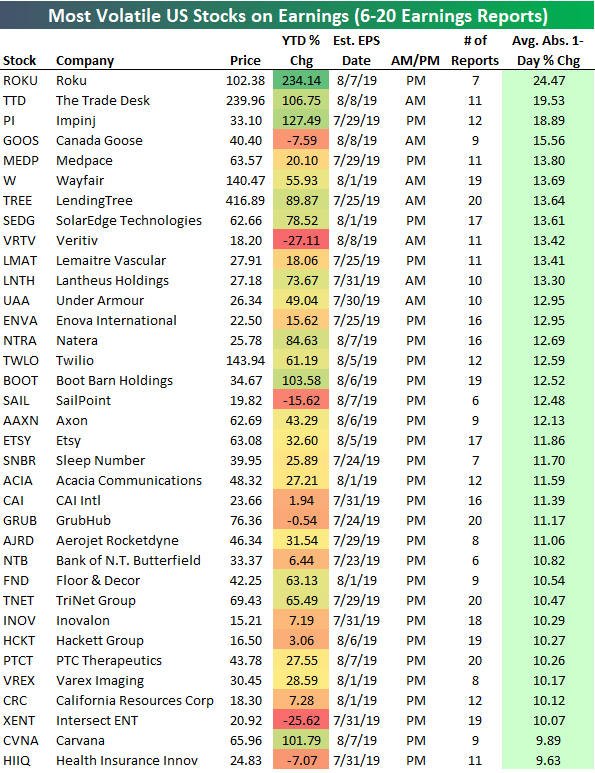
Finally, below is a list of companies that have between 6 and 20 quarterly earnings reports. Roku (ROKU) has 7 quarterly reports since it went public, and it has averaged a one-day move of nearly 25% on its earnings reaction day! The Trade Desk (TTD) has averaged a one-day move of +/-19.53% on its 11 earnings reports, while Inpinj (PI) has averaged a move of +/-18.89% on its 12 quarterly reports. Canada Goose (GOOS), Medpace (MEDP), and Wayfair (W) all average one-day moves of 13.6% or more.
Information posted to this board is not meant to suggest any specific action, but to point out the technical signs that can help our readers make their own specific decisions. Your Due Dilegence is a must! • DiscoverGold
Register for free to join our community of investors and share your ideas. You will also get access to streaming quotes, interactive charts, trades, portfolio, live options flow and more tools.


 News
News  Market Data
  Discover