DP WEEKLY WRAP: Watch Out For BPI Trend Breaks By: Carl Swenlin | July 5, 2019
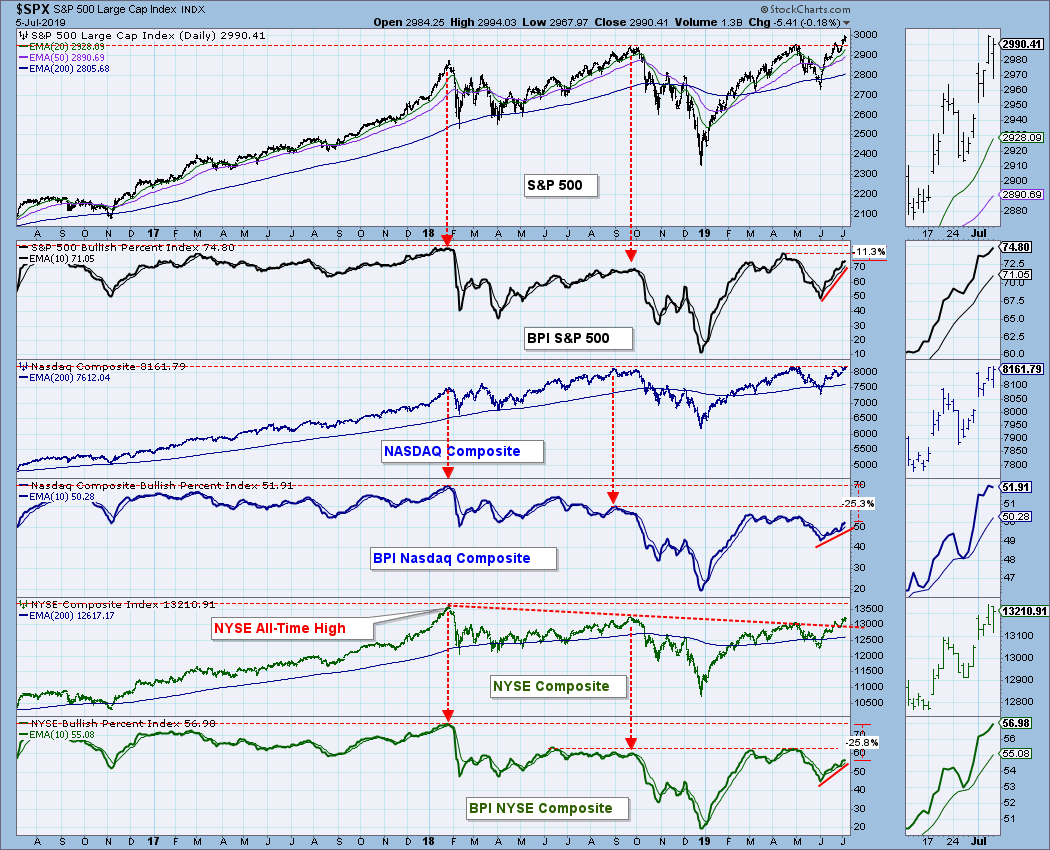
With the S&P 500 and NASDAQ Composite making or equaling all-time highs, it would be appropriate to check the participation behind this up surge. The Bullish Percent Index (BPI) measures the percentage of stocks in a given index that have point & figure BUY signals. In January of 2018 we can see that participation was very healthy with the SPX BPI at over 80, NASDAQ BPI at 70, and the NYSE BPI over 70. At the late-2018 market top, BPI participation was significantly lower, about -15% to -20% for each index. Currently, there has been some improvement in the SPX BPI, down only -11% from the 2018 BPI high, but the NASDAQ and NYSE BPIs are down -25% from their 2018 highs. This is an example of market indexes being supported primarily by large-cap stocks, which is an unhealthy situation. Nevertheless, in the short term we can see that the BPIs have been in a rising trend since June, so for the moment internals have a positive shine; however, if the BPIs break that trend line, watch out.
Notably, the NYSE Composite has been out of step with the SPX and NASDAQ, because, until last month it has remained below a declining tops line defining a bear market for that index. The NYSE BPI does not confirm the recent breakout above that line.
GLOBAL MARKETS
BROAD MARKET INDEXES
SECTORS
Each S&P 500 Index component stock is assigned to one, and only one, of 11 major sectors. This is a snapshot of the Intermediate-Term and Long-Term Trend Model signal status for those sectors.
INTEREST RATES
Because interest rates are currently inverted, I will be including a chart so we can watch the situation. In normal circumstances the longer money is borrowed the higher the interest rate that must be paid. When rates are inverted, the reverse is true. It is generally believed that rate inversions result from "a flight to safety." On the chart below, notice that the one-month and three month T-Bills (dotted lines) pay a higher interest rate than the one year through the 10-year T-Bonds. This is a serious problem for the stock market.
EARNINGS 2019 Q1
My quarterly earnings chart is available in a new ChartWatchers article.
STOCKS
IT Trend Model: BUY as of 6/11/2019
LT Trend Model: BUY as of 2/26/2019
SPY Daily Chart: Last Friday I commented on the very high volume for that day, which I said was probably traders getting flat ahead of the weekend. To be more precise, it was probably traders getting flat ahead of this hoiday week. SPY has formed a bearish rising wedge, and the VIX penetrated the upper Bollinger Band, which is short-term bearish. The wedge looks particularly weak because price rose off the bottom of the wedge this week, but it failed to reach the top of the wedge before touching the bottom of the wedge again today.
SPY Weekly Chart: What's not to like? Weekly PMO is positive and rising, and the market is making record highs.
Climactic Market Indicators: Wednesday was an exhaustion climax day, but with very short-term implications.
Short-Term Market Indicators: The STO-B and STO-V are overbought and they have topped. Looking for a short decline next week.
Intermediate-Term Market Indicators: These indicators are not terribly extended, but they are overbought and not likely to exceed their April/May tops.
CONCLUSION: Short-term indicators are overbought, and the rising wedge seems poised to fail, so I'm looking for a short correction next week. Intermediate-term indicators are overbought, and BPIs for broad market indexes are showing a sharp drop in participation compared to the January 2018 top, so we are additionally vulnerable in the intermediate-term. Additionally, the fundamental backdrop is negative with the market overvalued and the inverted yield curve. As I said earlier, if the broad market BPIs break their rising trends from the June low, it would be a very negative sign.
Click on "In reply to", for Authors past commentaries
Information posted to this board is not meant to suggest any specific action, but to point out the technical signs that can help our readers make their own specific decisions. Your Due Dilegence is a must! • DiscoverGold
Register for free to join our community of investors and share your ideas. You will also get access to streaming quotes, interactive charts, trades, portfolio, live options flow and more tools.


 News
News  Market Data
  Discover