


| Followers | 679 |
| Posts | 141047 |
| Boards Moderated | 36 |
| Alias Born | 03/10/2004 |
Thursday, June 27, 2019 12:26:27 AM
By: Seeking Alpha | June 23, 2019
Summary
• We are nearing an important trendline break to the upside in silver.
• The gold to silver ratio indicates silver has plenty of room to run higher in the coming years.
• Sentiment remains quite bearish and supportive of a multi-year upmove well beyond $20 an ounce.
• The math says we can challenge all-time highs around $50 in 3-5 years, and possibly reach triple-digit $100+ territory in 7-10 years.
• Record global money printing in the next recession will revalue fiat currencies dramatically lower and reprice monetary metals to a new higher plateau.
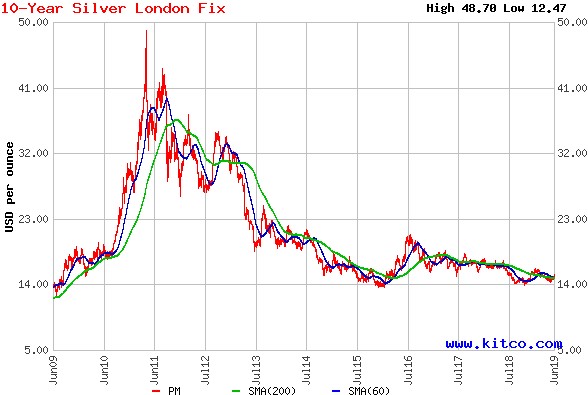
Silver bulls have been waiting for a turn higher in price for years. Peaking at a high of $50 an ounce in 2011, the silver price plummeted to $13 in early 2016. The last three and a half years have seen the price outline a basing pattern between $14 and $20. The late 2018 price successfully held $14, above the 2016 low of $13 an ounce. And the 2019 price is trading above the lows of last year. The next technical step could be a break out of its base to the upside.
Silver valuation is ultra-low vs. the rising gold price in 2019
Today’s gold to silver ratio of 91 is near the all-time high readings close to 100 during 1940 and 1990. Below is a chart drawn by Macrotrends showing it takes a near century-high 91 ounces of silver to buy an ounce of gold.

For long-term investors, silver’s value vs. gold is getting more interesting by the day. Currently silver is in the 97th percentile for relative cheapness to gold on a trailing 100-year basis. One can argue a silver price DOUBLE its current quote, closer to its mean average ratio of 45 ounces to one ounce of gold, is a reasonable forward expectation. Further, if gold prices rise robustly into 2020 from central bank money printing and trade war stresses, a rational observer can generate an all-time high forecast above $50 an ounce for silver the next 3-5 years. You can read my January Seeking Alpha article on why much higher gold and silver prices look inevitable in 2019-20, and July 2018 article preparing investors for the logic of $2,000 gold. I explain how gold has become completely mispriced on the downside vs. equities, debt levels, money supply and more.
Sentiment reached another extreme in May
Similar to the modern record bearish sentiment in the positioning of silver futures speculators vs. commercial hedgers in August-September 2018, the bottom price a few weeks ago may prove the low water mark for quite some time. Commercials usually cut short positioning and turn bullish when few other investors are willing take the long side. They have only been net long in the futures market during parts of 2018-19 the last three decades! Focusing on the modern record “long” positioning of commercial hedgers in silver last summer, a bet on smart money longs in silver vs. the speculative money short sellers has proven a good trade idea historically. You can review below the unprecedented net long holdings of commercial hedgers last summer represented by the blue line.

Image Source: SentimenTrader.com
May’s near record long positioning by commercial hedgers is again signaling a great intermediate-term entry point for new silver purchases, in my opinion. I am highlighting the similarities to 2018’s important silver market bottom in the graph below with red arrows.

Conversely, when commercials are deciding to become net long, speculative hot money traders are doing the opposite. During 2018-19, the usually long speculative crowd in silver has refused bullish views, and in fact reached rare net short levels. In backwards world, regular investors want nothing to do with silver ownership. Commodities tend to bottom when nobody is watching, after years of lackluster performance. Below is a graph of the low net speculative long holdings the last year.

Breaking this trendline opens a whole new world of upside
Heading into July, it appears the silver price is ready to break above a down sloping trendline drawn from the 2016 peak. If the price can move another 50 cents from Friday’s close to the upside, a clear cross over this technical line in the sand may point to a significant rise in silver quotes.
The iShares Silver Trust ETF (SLV) is perhaps the easiest, low-cost, highly liquid vehicle for small investors to trade silver assets in a regular brokerage account. This silver proxy is what I trade for paper silver exposure in my financial accounts. (Without a doubt owning physical silver bullion is preferable for long-term owners. However, owning SLV shares is a smart way to create paper profits in silver moves up and down, and hedge equity exposure in a stock holding account).
On the chart below you can review the trendline in green tested several times since 2016, forming overhead resistance for bulls. If SLV (silver) gets any type of bid the next month and can muscle above $14.75 into early July (falling to $14.60 by August), a sea change from declining long-term pricing to rising quotes may be at hand.

I have traded in and out of SLV several times the last year, opening a new stake on Friday for two reasons. First, the On Balance Volume (OBV) line is acting much better since December. This indicator of volume selling/buying pressure is already trading at a two-year high the last week, highlighted with the orange line on the graph above. Second, the June move higher in silver is turning the 200-day moving average UP for the first time in years. You can review on the chart below the green circle around the important 200-day MA reversal taking place.

Last week, the Federal Reserve announced it is preparing to lower interest rates (print money) to support the slowing U.S. economy. The monetary metals of gold and silver have jumped markedly since the Fed meeting, as they should. If the global economy is nearing recession from Trump’s trade wars, undoubtedly our record debt level in the history of humanity will have to be monetized with considerable and record paper money printing worldwide to prevent a catastrophe. Like every past U.S. economic cycle since we left a gold standard for dollars in the early 1970s, gold and silver will end up considerably higher when repriced in fiat U.S. dollars after another round of money printing has been absorbed by the economy. In a nutshell, that’s the main argument to own precious metals in 2019.
Conclusion
I have owned a number of silver miners since 2018, completely mispriced on the downside vs. an improving silver outlook long-term. I am again repurchasing long silver bullion-like positions in my brokerage accounts, as a major long-term reversal to the upside appears imminent.
The odds of a strong upmove in gold and silver seem to be improving daily as the economic data slows, and trade tensions with China continue to escalate. President Trump appears to be pushing for a new war with Iran the last several months. Any outbreak of military hostilities could spike oil inflation rates, alongside demand for the classic inflation hedges of gold and silver.
As an added boost for silver owners, the low gold to silver ratio could reverse course, producing outsized percentage gains for silver into the future. Overly bearish sentiment in silver the last year translates into plenty of shorts needing to cover. Sprinkle on top the expanding potential for new buyers to enter the marketplace in overwhelming numbers, and it’s hard not to be super bullish on silver today.
The supply/demand balance looks to favor a bullish slant for years to come. All we need is a break above the technical line in the sand on the charts, about 50 cents higher in price, for the floodgates of bullishness to open. At that point, silver holders could reap extraordinary gains, as a rush of buying dollars is mismatched against a low and stable physical supply of silver being sold daily. If demand jumps markedly, it may take material price hikes for existing above-ground investor supplies of silver to be brought to market. For sure, the silver market is getting more interesting by the day in June.
Far from guaranteed but logically argued, a 3-5 year silver price forecast above the all-time level of $50 an ounce seems more likely than not. Don’t laugh, a $3,000-5,000 gold price and normalized 45 gold to silver ratio morph silver closer to $100 from $15 an ounce presently. For long-term investors, 7-10 years from now, I place the odds at better than 50/50 that silver can reach triple digits. That’s what history and math argue is a probable outcome. Mathematically, investors buying silver today and burying it in their back yard could earn 20-25% annual compounded returns the next 7-10 years. Who needs the stock market?
Read Full Story »»»
• DiscoverGold
Information posted to this board is not meant to suggest any specific action, but to point out the technical signs that can help our readers make their own specific decisions. Your Due Dilegence is a must!
• DiscoverGold
NanoViricides Reports that the Phase I NV-387 Clinical Trial is Completed Successfully and Data Lock is Expected Soon • NNVC • May 2, 2024 10:07 AM
ILUS Files Form 10-K and Provides Shareholder Update • ILUS • May 2, 2024 8:52 AM
Avant Technologies Names New CEO Following Acquisition of Healthcare Technology and Data Integration Firm • AVAI • May 2, 2024 8:00 AM
Bantec Engaged in a Letter of Intent to Acquire a Small New Jersey Based Manufacturing Company • BANT • May 1, 2024 10:00 AM
Cannabix Technologies to Deliver Breath Logix Alcohol Screening Device to Australia • BLO • Apr 30, 2024 8:53 AM
Hydromer, Inc. Reports Preliminary Unaudited Financial Results for First Quarter 2024 • HYDI • Apr 29, 2024 9:10 AM

