


| Followers | 689 |
| Posts | 143817 |
| Boards Moderated | 35 |
| Alias Born | 03/10/2004 |
Friday, May 24, 2019 4:01:38 PM
By: Julius de Kempenaer | May 24, 2019
Relative Rotation Graphs can help to identify threats and opportunities within groups of securities. In this article, I will be looking at the position and rotation of the Communication Services Sector against the S&P 500 and other sectors, followed by a closer look at the rotation of various stocks inside that sector, especially Google.
From a Sector Perspective
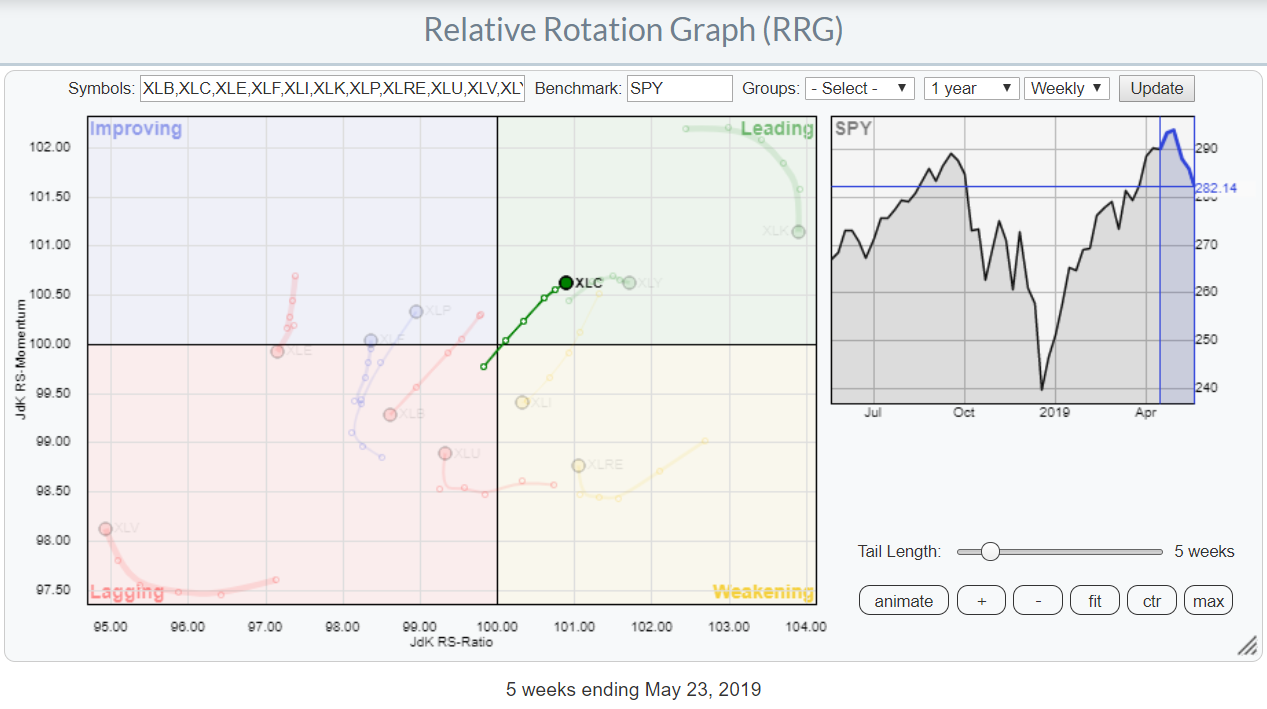
The RRG above shows the rotations for the 11 sectors in the S&P 500 index with Communication Services (XLC) highlighted.
The rotation into the leading quadrant at a strong RRG-Heading (0-90 degrees) indicates that this sector is in a relative uptrend against $SPX. Assuming a normal clockwise rotation, a continuation of that trend may be expected in the weeks to come.
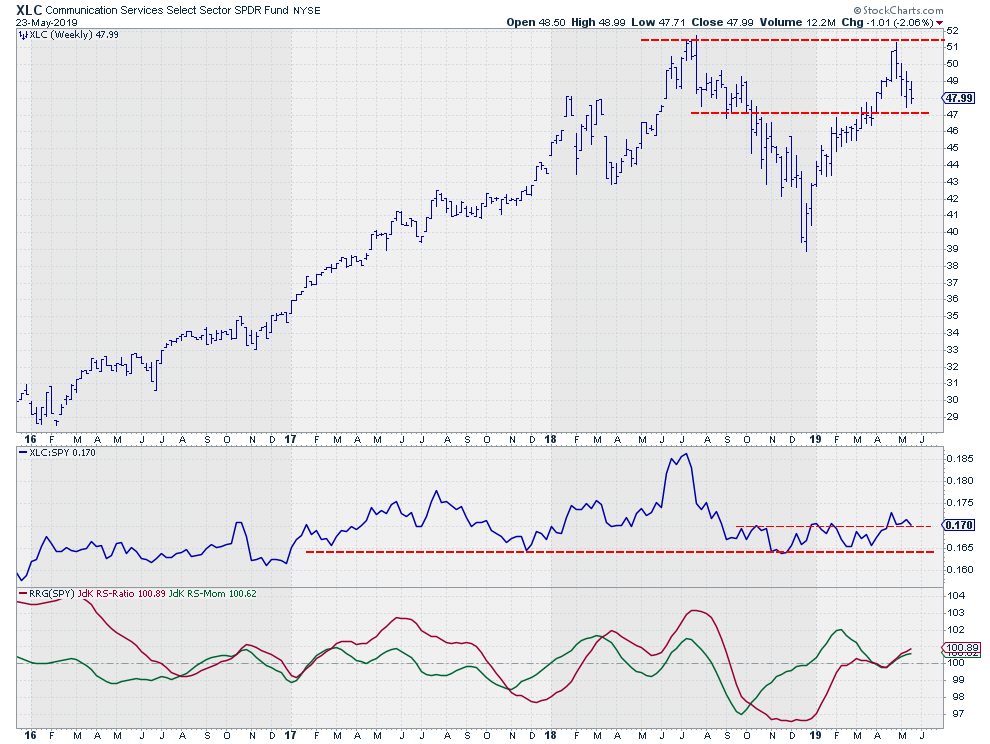
In line with the market, the Communication Services Sector failed to break above its prior high, which was set almost a year ago near $51. From a price perspective, that means that upside potential is capped around $51 for the time being.
On the downside, I am watching support in the area around $47, as supply and demand shifted around this level a few times in the last 12 months. With the sector ETF (XLC) trading around $48, that is a very limited downside risk for the time being.
A more positive message is coming from the relative strength line and the RRG-Lines comparing XLC with SPY.
After a strong decline in relative strength from July 2018 into November of that year, the RS-Line started to move in a range. The resulting RRG lines, especially the Jdk RS-Ratio, landed near the 100-level and remained close to these levels for a few months, meaning that this sector was moving in line with the S&P 500.
That situation recently came to an end when the RS-Line broke above its previous highs. It currently seems to be completing a bottoming process. The RRG-Lines picked up the improvement in April when they both bounced off the 100-level and started to rise together. This move is positioning the Communication Services sector well inside the leading quadrant, while still traveling at an RRG-Heading between 0-90 degrees.
A Look Inside
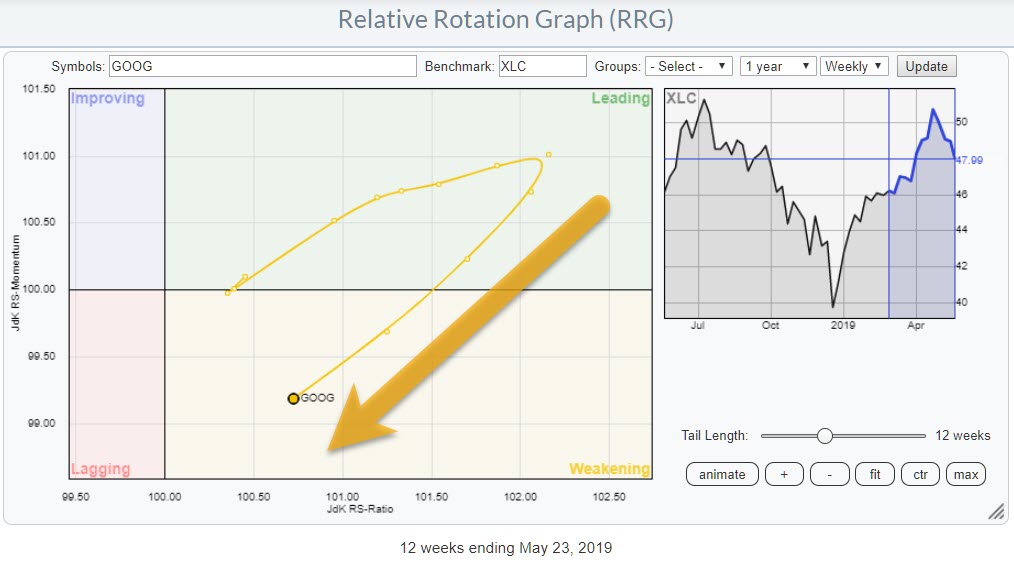
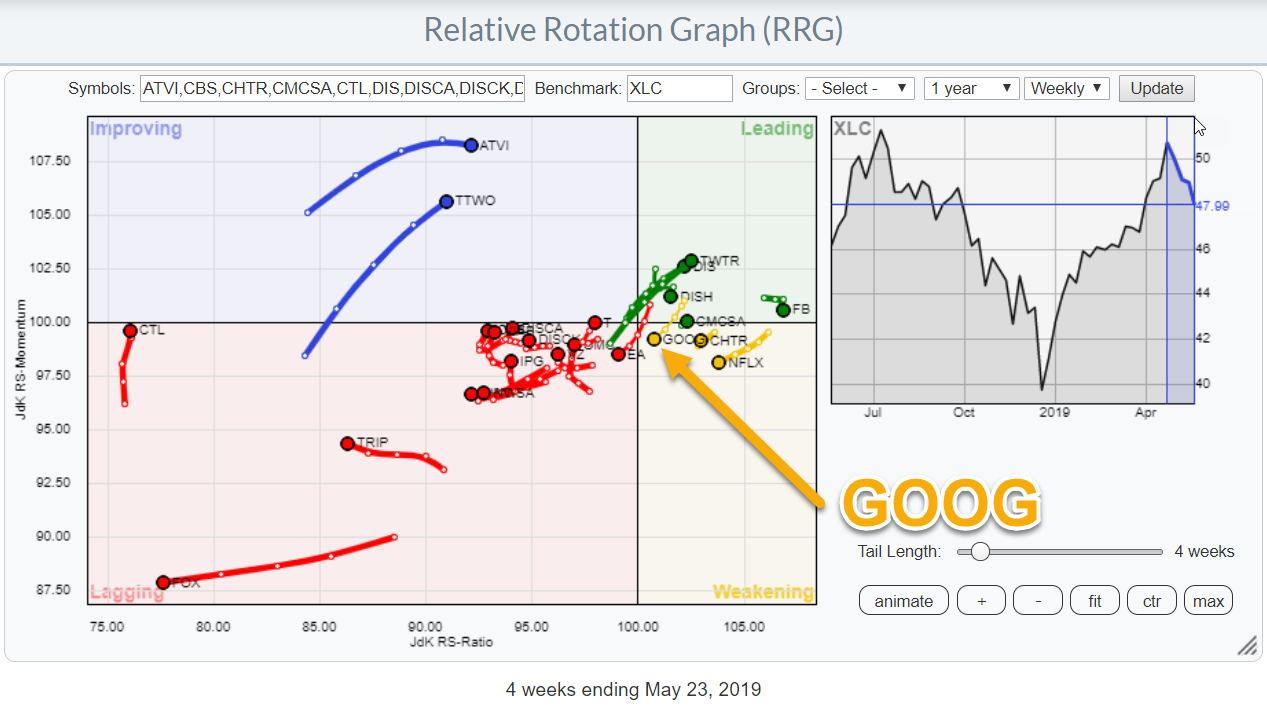
The RRG at the top of this article shows the complete population of the Communication Services sector against XLC (the benchmark). On that graph, GOOG is somewhat buried between other stocks and is not very visible. In order to zoom in on this particular stock and better see the recent rotation, I have printed the same RRG, but now only showing GOOG vs XLC.
The recent rotation clearly shows the weakness that Google is going through versus XLC. With a little over 11% weight for GOOG and GOOGL each, this totals around 22% total weight for Google within the sector. The good news is that this weakness is largely offset by Facebook. FB also accounts for 20% of the sector and is much further to the right in the RRG, at a high reading on the JdK RS-Ratio scale. That said, Disney, which is the fourth largest stock, is worth approaching from the long side.
Alphabet Inc - GOOG
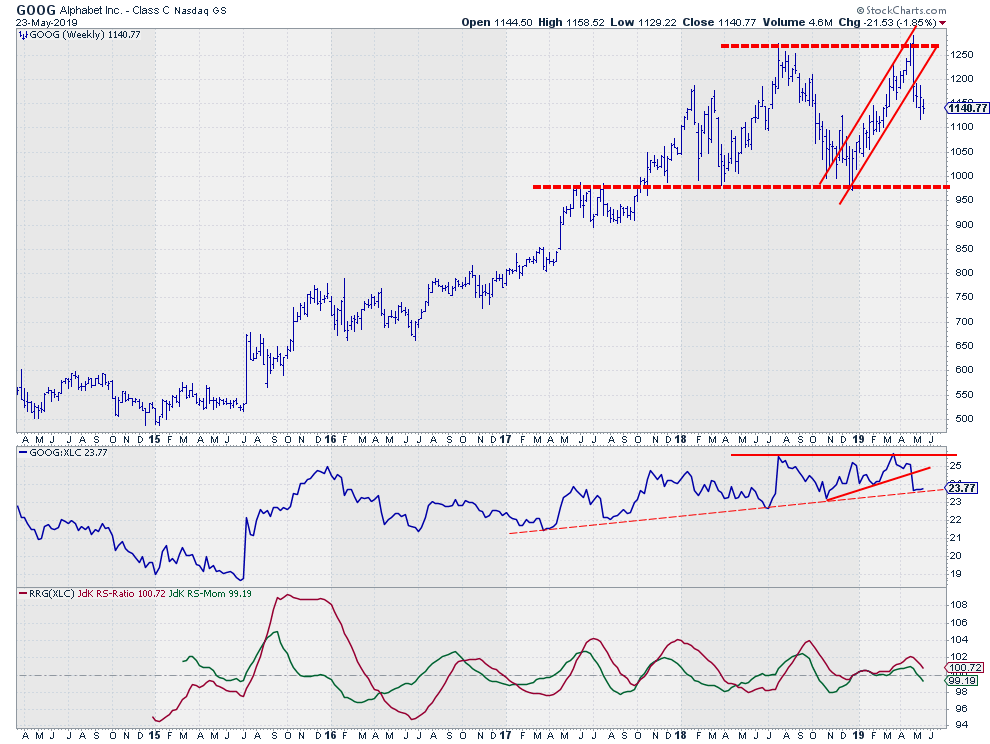
On the price chart, GOOG bounced off its former highs and left the rising channel that came into play at the end of 2018. The lower boundary of this range lies around $975, which is roughly 15% below current levels.
The RS-Line recently broke a short-term support line (solid) and is now resting at a longer version (dashed), while the RS-Momentum line has crossed below 100 and RS-Ratio is heading towards that level as well. A rotation into lagging seems to be around the corner.
All in all, the Communications Services sector is doing well compared to the S&P 500. Within the sector, however, it seems better to avoid Google for now.
Julius de Kempenaer
Read Full Story »»»
• DiscoverGold
Information posted to this board is not meant to suggest any specific action, but to point out the technical signs that can help our readers make their own specific decisions. Your Due Dilegence is a must!
• DiscoverGold
Recent GOOG News
- MongoDB and Google Cloud Collaborate to Optimize Gemini Code Assist for Developers Building Applications on MongoDB • PR Newswire (US) • 05/02/2024 10:00:00 AM
- Google Terminates Employees Over Protests Against Israeli Government Contract • IH Market News • 04/18/2024 12:20:50 PM
- Apple in Talks with Google to Integrate Gemini AI into iPhone, Shaping a New Era in Tech Collaboration • IH Market News • 03/19/2024 10:39:54 AM
- Futures Pointing To Continued Weakness On Wall Street • IH Market News • 03/05/2024 02:03:27 PM
- U.S. Stocks May Lack Direction Following Yesterday’s Modest Pullback • IH Market News • 02/27/2024 02:14:46 PM
- FTC to Inquire to Microsoft's, Google's, Amazon's AI Partnerships • Dow Jones News • 01/25/2024 06:12:00 PM
- Lüm Mobile Taps Alepo's TelcoBot.ai for Generative AI Customer Service • PR Newswire (US) • 01/25/2024 04:00:00 PM
- Alphabet on Track for Record High Close -- Data Talk • Dow Jones News • 01/25/2024 03:45:00 PM
- Google to Settle Chip Patent Lawsuit With Singular Computing • Dow Jones News • 01/24/2024 07:15:00 PM
- Alphabet Division X Cutting Dozens of Staff, Bloomberg Reports • Dow Jones News • 01/22/2024 04:32:00 PM
- Alphabet on Track for Highest Close Since February 2022 -- Data Talk • Dow Jones News • 01/22/2024 03:36:00 PM
- AST SpaceMobile Gets Investments From AT&T, Google • Dow Jones News • 01/18/2024 10:00:00 PM
- Google to Invest $1 Billion to Build UK Data Center • Dow Jones News • 01/18/2024 06:51:00 PM
- Applied Materials, Google to Collaborate on AR Technology • Dow Jones News • 01/09/2024 01:12:00 PM
- Alphabet on Track for Highest Close Since April 2022 -- Data Talk • Dow Jones News • 12/20/2023 03:49:00 PM
- Trending: Alphabet to Pay $700 Million in Google Play Settlement • Dow Jones News • 12/19/2023 08:13:00 PM
- Trending: Epic Games Wins Antitrust Lawsuit Against Google • Dow Jones News • 12/12/2023 03:50:00 PM
- Alphabet on Pace for Largest Percent Increase Since July -- Data Talk • Dow Jones News • 12/07/2023 03:22:00 PM
- Google, Canada Reach Deal Over Planned Online News Law • Dow Jones News • 11/29/2023 08:05:00 PM
- Google, Canadian Government Reach Deal on Online News Act, CBC Reports • Dow Jones News • 11/29/2023 05:23:00 PM
- VMware and Google Cloud announce planned PostgreSQL-compatible Database Solution for traditional and generative AI applications on VMware Cloud Foundation • Business Wire • 11/07/2023 08:05:00 AM
- Match Group, Google Reach Binding Term Sheet in Legal Battle • Dow Jones News • 10/31/2023 09:29:00 PM
- Alphabet Ends Down 9.5%, Sees Largest Percent Decrease Since March 2020 -- Data Talk Update • Dow Jones News • 10/25/2023 08:59:00 PM
- Alphabet Down Over 8%, on Pace for Largest Percent Decrease in Almost a Year -- Data Talk • Dow Jones News • 10/25/2023 02:48:00 PM
- Stocks to Watch: Microsoft, Alphabet, Stride • Dow Jones News • 10/25/2023 12:16:00 AM
VHAI - Vocodia Partners with Leading Political Super PACs to Revolutionize Fundraising Efforts • VHAI • Sep 19, 2024 11:48 AM
Dear Cashmere Group Holding Co. AKA Swifty Global Signs Binding Letter of Intent to be Acquired by Signing Day Sports • DRCR • Sep 19, 2024 10:26 AM
HealthLynked Launches Virtual Urgent Care Through Partnership with Lyric Health. • HLYK • Sep 19, 2024 8:00 AM
Element79 Gold Corp. Appoints Kevin Arias as Advisor to the Board of Directors, Strengthening Strategic Leadership • ELMGF • Sep 18, 2024 10:29 AM
Mawson Finland Limited Further Expands the Known Mineralized Zones at Rajapalot: Palokas step-out drills 7 metres @ 9.1 g/t gold & 706 ppm cobalt • MFL • Sep 17, 2024 9:02 AM
PickleJar Announces Integration With OptCulture to Deliver Holistic Fan Experiences at Venue Point of Sale • PKLE • Sep 17, 2024 8:00 AM

