


| Followers | 680 |
| Posts | 141212 |
| Boards Moderated | 36 |
| Alias Born | 03/10/2004 |
Friday, May 17, 2019 8:22:32 AM
Fund Managers' Current Asset Allocation - May
By: Urban Carmel | May 14, 2019
Summary: Although fund managers are less bearish than they were at the start of 2019, they are far from being bullish. They are overweight cash. Their global equity allocations are almost a standard deviation below the mean. Their bond allocations are at a 7-year high. A slight majority expect profits to contract and economic growth to fall in the next year.
This is a far cry from 2018, when fund managers came into the year with cash levels at 4-year lows and allocations to global equities at 3-year highs. Global equities ended the year 15% lower.
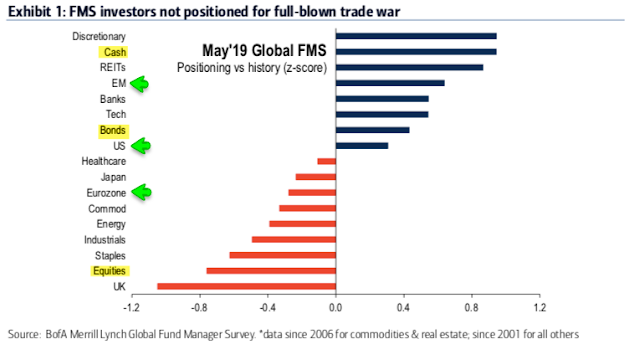
US and European equity allocations remain low relative to levels seen at prior market peaks. Emerging markets are the consensus long. The US dollar is considered the most overvalued in 16 years, a possible tailwind for US multi-nationals and ex-US equities.
* * *
Among the various ways of measuring investor sentiment, the Bank of America Merrill Lynch (BAML) survey of global fund managers is one of the best, as the results reflect how managers are allocated in various asset classes. These managers oversee a combined $600b in assets.
Our sincere gratitude to BAML for the use of this data.
The data should be viewed mostly from a contrarian perspective; that is, when equities fall in price, allocations to cash go higher and allocations to equities go lower as investors become bearish, setting up a buy signal. When prices rise, the opposite occurs, setting up a sell signal. We did a recap of this pattern in December 2014 (post).
Let's review the highlights from the past month.
Overall: Relative to history, fund managers are overweight cash and underweight equities. Enlarge any image by clicking on it.
Within equities, the emerging markets are overweight while Europe, in particular, is underweight. The US is close to neutral.
A pure contrarian would overweight equities relative to cash and bonds, and European equities relative to emerging markets.
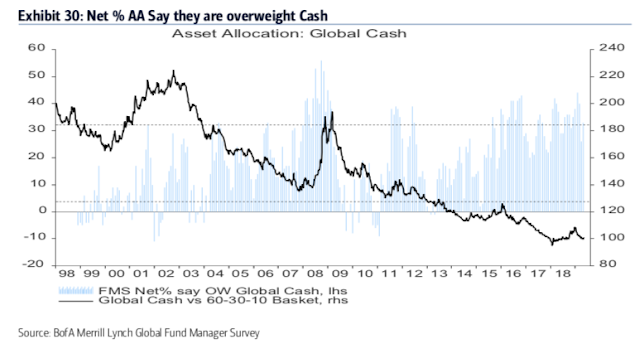
Cash: Fund managers' cash balance is high at 4.6%, down just slightly from 4.8% in February. BAML considers cash levels above 4.5% to be a contrarian buy for equities, and below 3.5% to be a contrarian sell. This is supportive of further gains in global equities:
In October 2016, fund managers' cash levels rose to 5.8%, the highest cash level since November 2001. Global equities rose over 30% in the next year.
By November 2017, cash levels had fallen to 4.4%, the lowest level since October 2013. Equities peaked in January 2018 and then fell 20% during the remainder of the year.
At 4.6%, current cash allocations are high enough to remain a tailwind for global equities.

Likewise, fund managers are a net +33% overweight cash (+0.9 standard deviations above its long term mean). In the context of a bull market, cash should underperform a 60-30-10 basket (equity-bonds-cash).
Global equities: Fund managers' global equity allocations are up just slightly to +11% overweight from +6% overweight in January. This is supportive of further gains in global equities:
At the market low in January 2019, fund managers were just +6% overweight equities. This equity allocation level was similar to that other market lows since 2009 (green arrows).
At the market peak in January 2018, by contrast, equity allocations were +55% overweight. Over 50% is a level at which equities have previously peaked, although the lag can be considerable (e.g., 2013-14; red arrows).
At just +11% overweight (-0.8 standard deviations below its long term mean), fund managers are far from being too bullish. This remains a tailwind for global equities.
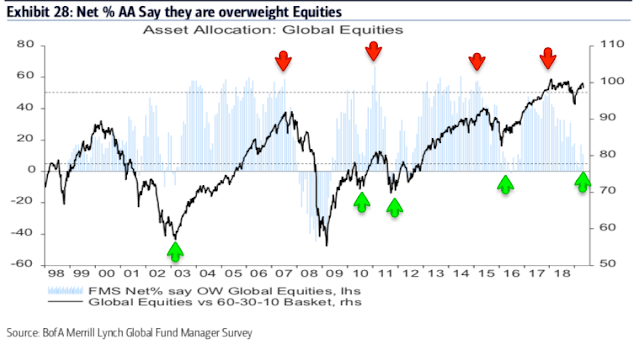
Fund managers are not bullish on profits, with a slight majority expecting a contraction in the next 12 months. But this is a marked improvement from January when 52% expected profits to deteriorate, their most bearish view in 10 years. Negative profit expectations marked equity lows in mid-2010, late-2011, mid-2012, early 2016 and January 2019 (green arrows).

Similarly, a net -5% expect a better economy in the next year, up from -60% in January, the lowest since equities crashed in November 2008. At the equity peak in January 2018, a net +47% expected a better economy. Investors are not bullish on the global economy.

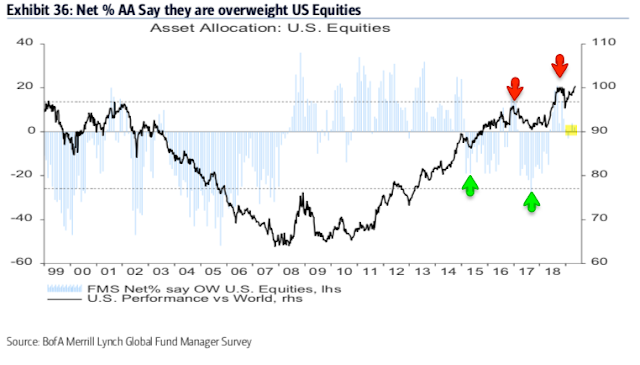
US equities: Fund managers have only slightly increased their allocations to US equities, to +2% overweight from -3% underweight in February. There is room for US equities to rise further:
When fund managers have been more than -20% underweight US equities (e.g., spring 2015 and autumn 2017), US equities have subsequently outperformed (green arrows).
When fund managers have been more than +15-20% overweight (e.g., December 2016 and November 2018), US equities have subsequently underperformed (red arrows).
At just +2% overweight (+0.3 standard deviations above its long term mean), fund managers are far from being too bullish. A contrarian would expect the region to outperform.
(Note that the relationship between performance and weighting worked less well in the prior expansion cycle (2003-07) as emerging markets outperformed developed markets by about 5 times)....
* * *
Read Full Story »»»
• DiscoverGold
By: Urban Carmel | May 14, 2019
Summary: Although fund managers are less bearish than they were at the start of 2019, they are far from being bullish. They are overweight cash. Their global equity allocations are almost a standard deviation below the mean. Their bond allocations are at a 7-year high. A slight majority expect profits to contract and economic growth to fall in the next year.
This is a far cry from 2018, when fund managers came into the year with cash levels at 4-year lows and allocations to global equities at 3-year highs. Global equities ended the year 15% lower.
US and European equity allocations remain low relative to levels seen at prior market peaks. Emerging markets are the consensus long. The US dollar is considered the most overvalued in 16 years, a possible tailwind for US multi-nationals and ex-US equities.
* * *
Among the various ways of measuring investor sentiment, the Bank of America Merrill Lynch (BAML) survey of global fund managers is one of the best, as the results reflect how managers are allocated in various asset classes. These managers oversee a combined $600b in assets.
Our sincere gratitude to BAML for the use of this data.
The data should be viewed mostly from a contrarian perspective; that is, when equities fall in price, allocations to cash go higher and allocations to equities go lower as investors become bearish, setting up a buy signal. When prices rise, the opposite occurs, setting up a sell signal. We did a recap of this pattern in December 2014 (post).
Let's review the highlights from the past month.
Overall: Relative to history, fund managers are overweight cash and underweight equities. Enlarge any image by clicking on it.
Within equities, the emerging markets are overweight while Europe, in particular, is underweight. The US is close to neutral.
A pure contrarian would overweight equities relative to cash and bonds, and European equities relative to emerging markets.

Cash: Fund managers' cash balance is high at 4.6%, down just slightly from 4.8% in February. BAML considers cash levels above 4.5% to be a contrarian buy for equities, and below 3.5% to be a contrarian sell. This is supportive of further gains in global equities:
In October 2016, fund managers' cash levels rose to 5.8%, the highest cash level since November 2001. Global equities rose over 30% in the next year.
By November 2017, cash levels had fallen to 4.4%, the lowest level since October 2013. Equities peaked in January 2018 and then fell 20% during the remainder of the year.
At 4.6%, current cash allocations are high enough to remain a tailwind for global equities.

Likewise, fund managers are a net +33% overweight cash (+0.9 standard deviations above its long term mean). In the context of a bull market, cash should underperform a 60-30-10 basket (equity-bonds-cash).

Global equities: Fund managers' global equity allocations are up just slightly to +11% overweight from +6% overweight in January. This is supportive of further gains in global equities:
At the market low in January 2019, fund managers were just +6% overweight equities. This equity allocation level was similar to that other market lows since 2009 (green arrows).
At the market peak in January 2018, by contrast, equity allocations were +55% overweight. Over 50% is a level at which equities have previously peaked, although the lag can be considerable (e.g., 2013-14; red arrows).
At just +11% overweight (-0.8 standard deviations below its long term mean), fund managers are far from being too bullish. This remains a tailwind for global equities.

Fund managers are not bullish on profits, with a slight majority expecting a contraction in the next 12 months. But this is a marked improvement from January when 52% expected profits to deteriorate, their most bearish view in 10 years. Negative profit expectations marked equity lows in mid-2010, late-2011, mid-2012, early 2016 and January 2019 (green arrows).

Similarly, a net -5% expect a better economy in the next year, up from -60% in January, the lowest since equities crashed in November 2008. At the equity peak in January 2018, a net +47% expected a better economy. Investors are not bullish on the global economy.

US equities: Fund managers have only slightly increased their allocations to US equities, to +2% overweight from -3% underweight in February. There is room for US equities to rise further:
When fund managers have been more than -20% underweight US equities (e.g., spring 2015 and autumn 2017), US equities have subsequently outperformed (green arrows).
When fund managers have been more than +15-20% overweight (e.g., December 2016 and November 2018), US equities have subsequently underperformed (red arrows).
At just +2% overweight (+0.3 standard deviations above its long term mean), fund managers are far from being too bullish. A contrarian would expect the region to outperform.
(Note that the relationship between performance and weighting worked less well in the prior expansion cycle (2003-07) as emerging markets outperformed developed markets by about 5 times)....

* * *
Read Full Story »»»
• DiscoverGold
Information posted to this board is not meant to suggest any specific action, but to point out the technical signs that can help our readers make their own specific decisions. Your Due Dilegence is a must!
• DiscoverGold
Join the InvestorsHub Community
Register for free to join our community of investors and share your ideas. You will also get access to streaming quotes, interactive charts, trades, portfolio, live options flow and more tools.

