


| Followers | 680 |
| Posts | 141194 |
| Boards Moderated | 36 |
| Alias Born | 03/10/2004 |
Thursday, May 16, 2019 8:15:50 AM
By: Tim Ord | May 15, 2019
SPX Monitoring purposes; Sold long SPX on 5/13/19 at 2811.87 = loss 2.05%; Long 5/9/19 at 2870.72.
Monitoring purposes Gold: Long VanEck Vectors Gold Miners ETF (NYSE:GDX) on 1/29/19 at 21.96.
Long-term Trend SPX monitor purposes; Sold long SPX on 5/6/19 at 2932.61= gain 5.96%:
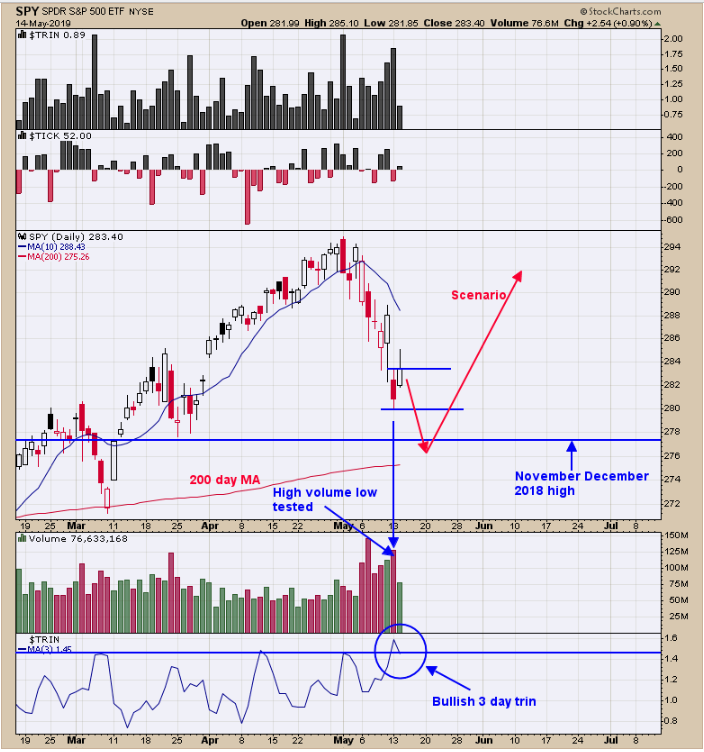
Yesterday’s low had higher volume than the day before suggests yesterday’s low needs testing on lighter volume before a final low is in. Today’s rally tested yesterday’s high on lighter volume which implies resistance and a pull back is in order. The “3 day TRIN” did reach in bullish levels yesterday. Support comes in November and December 2018 highs and the 200-day moving average which comes in the range of 275 to 277 SPY (NYSE:SPY) range and an area to what for a bullish setup.
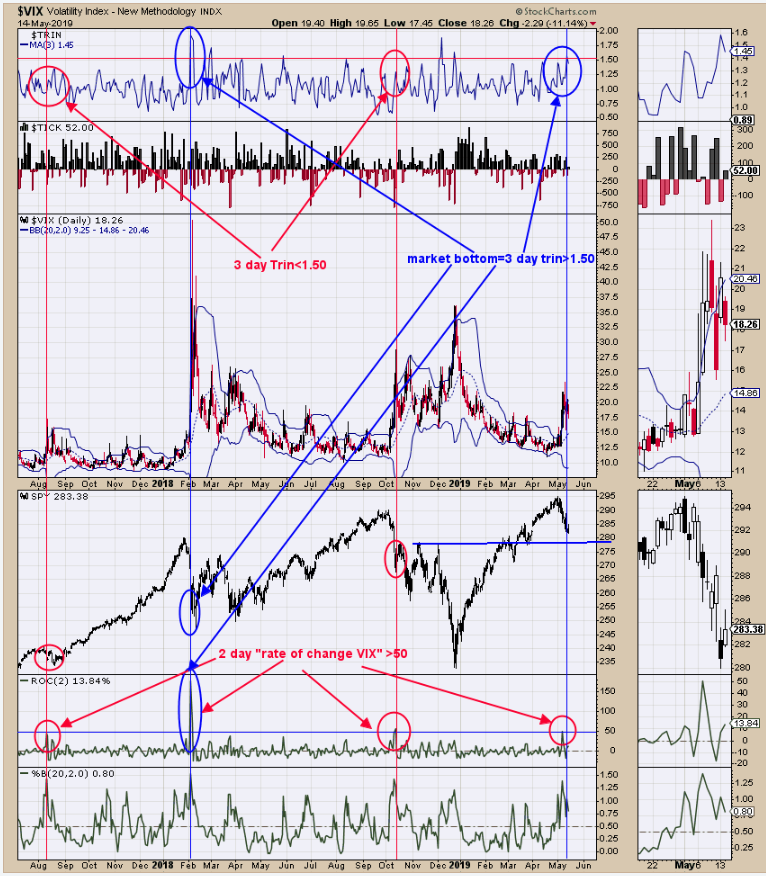
Couple of days ago we had this chart shown. At the time we where looking for a bounce than testing lower. The bounce came but short lived and we didn’t get out. Now the testing will most likely produce a bounce that could last. The top window is the 3 day trin and when it hits above 1.50 a lasting rally usually follows and yesterday we hit above 1.50. The second window up from the bottom is the Rate of change for the CBOE Volatility Index and when it hits above 50% which is did a bottom is not far off. Today’s rally tested yesterday’s down gap on lighter volume which imply resistance and yesterday’s low had high volume which is usually tested. Don’t believe the final low is in but is very near. Testing below 2800 on the SPX may produce more panic readings in the tick and trin.
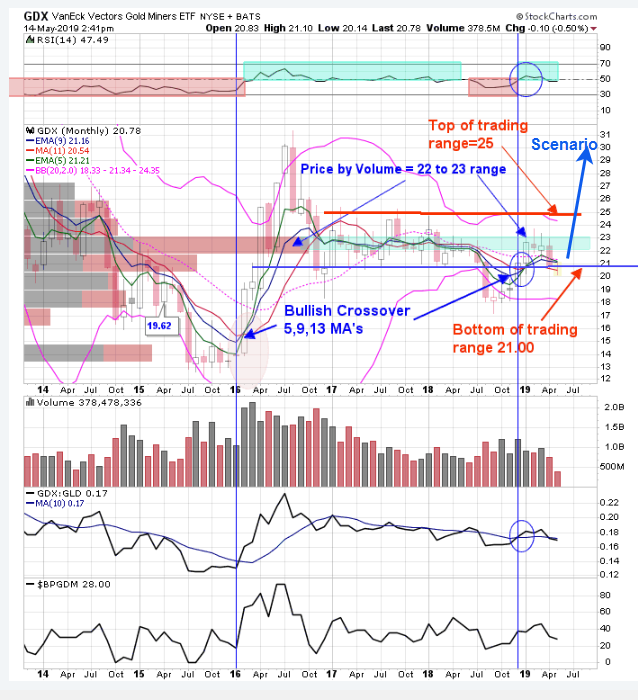
Above is the monthly VanEck Vectors Gold Miners ETF (NYSE:GDX) chart. We have a 5, 9, 13 period moving average on the monthly GDX chart going back to 2014. A bullish crossover occurred back in January which is still in force. The bottom of the trading range in 2017 comes in near 21.00 range. GDX fell below this level in August 2018 and than closed above it in December 2018 creating a bullish “Shakeout” (false breakout). When a down side “Shakeout” occurs the market normally breakouts to the top side, which would imply a break above the top of the trading range near 25.00. GDX is now back testing the support near 21.00 and appear to be finding support. There is a “Price by Volume” level between 22.00 to 23.00 range which GDX run into in February and March which stopped the advance. Once through this level it should provide support. GDX has been in a low volatility state since 2017 and bigger swings should start to develop in the coming months. After the current back test is completed, an impulse wave higher may begin that could last into October. Long GDX on 1/29/19 at 21.97.
Read Full Story »»»
• DiscoverGold
Click on "In reply to", for Authors past commentaries
Information posted to this board is not meant to suggest any specific action, but to point out the technical signs that can help our readers make their own specific decisions. Your Due Dilegence is a must!
• DiscoverGold
Recent GOLD News
- Barrick Announces Extensive Exploration Partnership with Geophysx Jamaica • GlobeNewswire Inc. • 05/01/2024 10:15:00 AM
- Barrick to Ramp Up Production As It Remains On Track to Achieve 2024 Targets • GlobeNewswire Inc. • 05/01/2024 10:00:00 AM
- Barrick Declares Q1 Dividend • GlobeNewswire Inc. • 05/01/2024 09:59:00 AM
- Barrick Announces Election of Directors • GlobeNewswire Inc. • 04/30/2024 08:15:55 PM
- Barrick On Track to Achieve 2024 Targets • GlobeNewswire Inc. • 04/16/2024 11:00:00 AM
- Notice of Release of Barrick’s First Quarter 2024 Results • GlobeNewswire Inc. • 04/09/2024 11:00:00 AM
- Strategy-Driven Barrick Builds on Value Foundation • GlobeNewswire Inc. • 03/28/2024 09:20:38 PM
- Barrick Hunts New Gold and Copper Prospects in DRC From Kibali Base • GlobeNewswire Inc. • 03/20/2024 02:00:00 PM
- Barrick Opens Academy at Closed Buzwagi Mine • GlobeNewswire Inc. • 03/18/2024 08:00:00 AM
- Barrick to Grow Production and Value on Global Asset Foundation • GlobeNewswire Inc. • 03/15/2024 11:53:01 AM
- Loulo-Gounkoto Delivers Another Value-Creating Performance • GlobeNewswire Inc. • 03/10/2024 10:00:00 AM
- Passing of the Right Honorable Brian Mulroney • GlobeNewswire Inc. • 03/02/2024 01:17:35 AM
- Kibali and DRC Partner to Promote Local Content • GlobeNewswire Inc. • 03/01/2024 02:22:43 PM
- Tanzanian Parliamentary Committee Lauds Barrick’s Work at North Mara • GlobeNewswire Inc. • 02/23/2024 12:00:00 PM
- Form 6-K - Report of foreign issuer [Rules 13a-16 and 15d-16] • Edgar (US Regulatory) • 02/14/2024 10:28:08 PM
- Form 6-K - Report of foreign issuer [Rules 13a-16 and 15d-16] • Edgar (US Regulatory) • 02/14/2024 08:05:25 PM
- Clear Strategies and Strong Partnerships Set Barrick Up to Outperform, Says Bristow • GlobeNewswire Inc. • 02/14/2024 11:00:00 AM
- Barrick Announces New Share Buyback Program • GlobeNewswire Inc. • 02/14/2024 10:59:00 AM
- Barrick Declares Q4 Dividend • GlobeNewswire Inc. • 02/14/2024 10:58:00 AM
- NGM Strongly Positioned for Growth • GlobeNewswire Inc. • 02/10/2024 01:00:16 AM
- Form SC 13G - Statement of acquisition of beneficial ownership by individuals • Edgar (US Regulatory) • 02/08/2024 03:03:08 PM
- Form 6-K - Report of foreign issuer [Rules 13a-16 and 15d-16] • Edgar (US Regulatory) • 02/08/2024 12:46:55 PM
- Geologically Driven Asset Management Delivers Barrick’s Third Successive Year of Reserve Growth at Sustained Quality, While Unlocking Embedded Growth Portfolio • GlobeNewswire Inc. • 02/08/2024 12:00:00 PM
- Form SC 13G/A - Statement of acquisition of beneficial ownership by individuals: [Amend] • Edgar (US Regulatory) • 02/01/2024 06:04:56 PM
- Africa’s Largest Gold Mine Now Also One of Its Greenest • GlobeNewswire Inc. • 01/29/2024 04:00:00 PM
Avant Technologies Equipping AI-Managed Data Center with High Performance Computing Systems • AVAI • May 10, 2024 8:00 AM
VAYK Discloses Strategic Conversation on Potential Acquisition of $4 Million Home Service Business • VAYK • May 9, 2024 9:00 AM
Bantec's Howco Awarded $4.19 Million Dollar U.S. Department of Defense Contract • BANT • May 8, 2024 10:00 AM
Element79 Gold Corp Successfully Closes Maverick Springs Option Agreement • ELEM • May 8, 2024 9:05 AM
Kona Gold Beverages, Inc. Achieves April Revenues Exceeding $586,000 • KGKG • May 8, 2024 8:30 AM
Epazz plans to spin off Galaxy Batteries Inc. • EPAZ • May 8, 2024 7:05 AM

