


| Followers | 689 |
| Posts | 143817 |
| Boards Moderated | 35 |
| Alias Born | 03/10/2004 |
Tuesday, May 14, 2019 12:08:58 PM
By: Julius de Kempenaer | May 14, 2019
After a struggle with resistance around its previous high around 2940, the stock market, S&P 500 index, failed to break and started to come down off its highs.
A lot of political and fundamental issues and news are influencing the behavior of market participants at the moment and this uncertainty results in a rally of the VIX index at the moment.
In times like this people start to look for safe havens. These can be (government) bonds, preferably at short maturities, or defensive sectors but also GOLD.
Scanning some headlines across the internet and also here at Stockcharts.com I noted an increased interest for the price of Gold recently.
Martin Pring recently wrote about that in his MArket Roundup article that you can find here. And as you know Relative Rotation Graphs can be used to visualize any universe as long as you stick to comparing apples with apples and oranges with oranges.
So for this article, I want to focus on the RRG for Commodities and add Gold, which is part of the Precious metals group, to the mix.
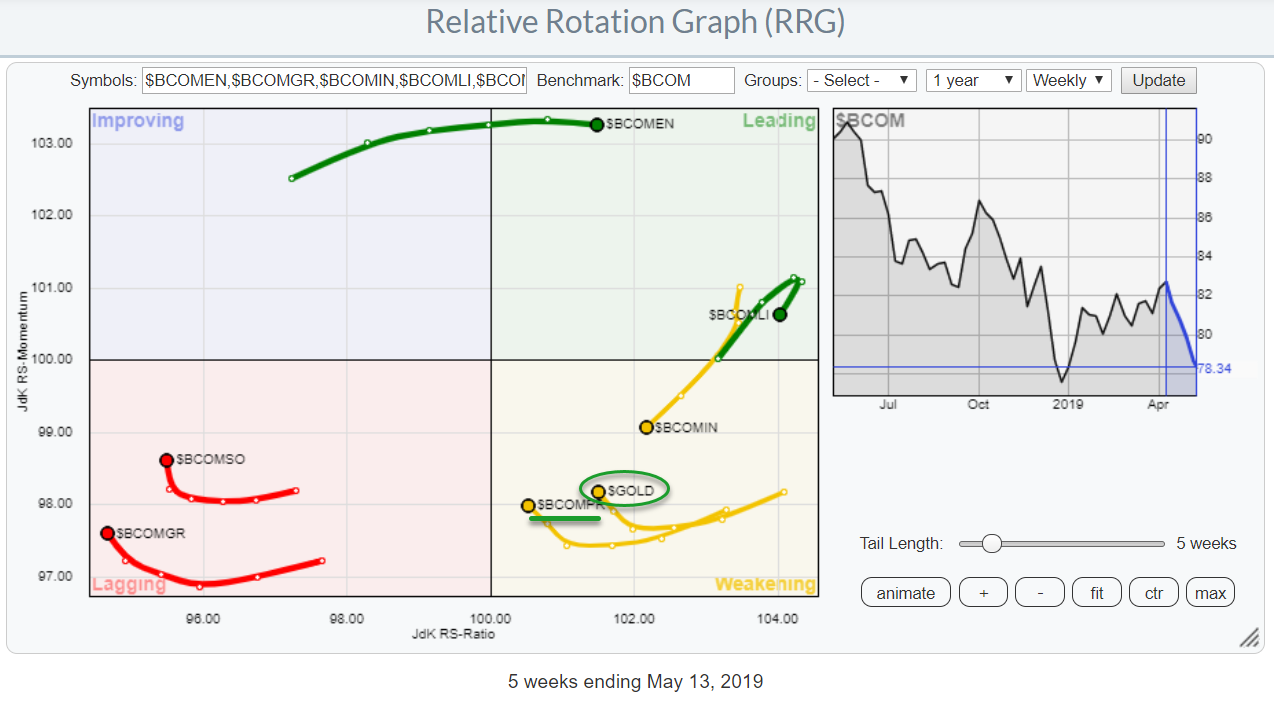
The RRG above shows the rotation of the various Bloomberg Commodity Indexes plus $GOLD against the general Bloomberg commodity index.
You can find more information about the composition, the breakdown, and the weights for this index at this link.
The Energy ($BCOMEN) and Livestock ($BCOMLI) are both inside the leading quadrant with energy continuing to do well at high JdK RS-Momentum levels and a steady pace on the Jdk RS-Ratio scale. This indicates a stable trend in outperformance that is still ongoing.
Livestock shows a rapid rotation towards the weakening quadrant. Despite the fact that this is still the strongest group measured on the JdK RS-ratio scale, this rotation suggests some weakness ahead at least for the near term.
Precious Metals
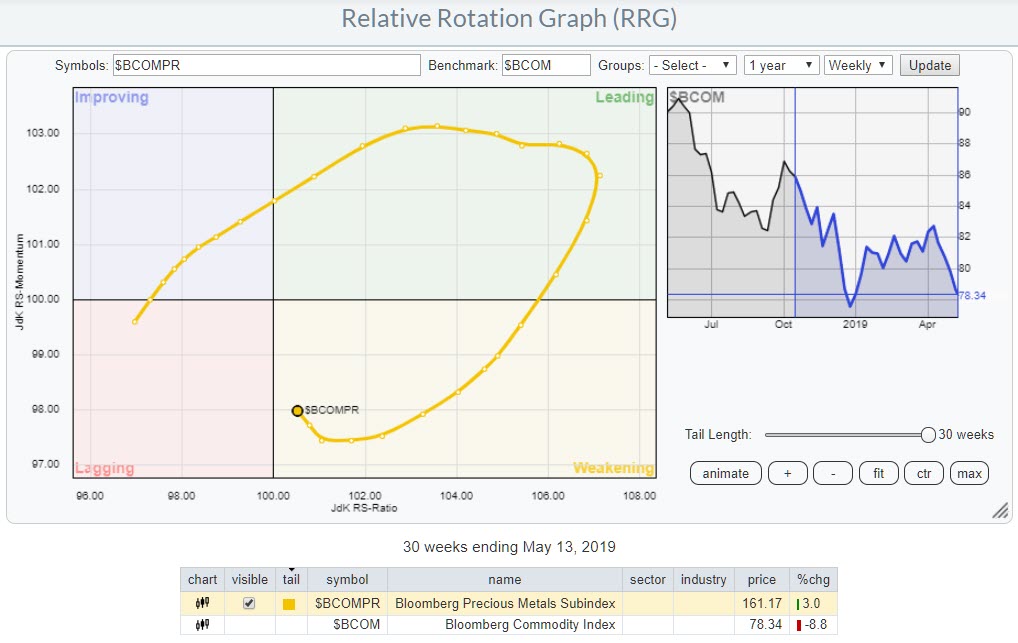
On the RRG for commodities against the general commodity index, Precious Metals is inside the weakening quadrant after a strong rotation through leading.
The precious metals group entered the leading quadrant in December last year and continued to push higher on the RS-Ratio axis until March when it started to roll over and lose momentum. This resulted in a crossover into the weakening quadrant where it still is today.
But as you can see the tail has started to curl upward again and seems to be picking up steam. If this rotation can continue clockwise and move back into the leading quadrant, precious metals are all set for a new relative uptrend.
Gold And Silver
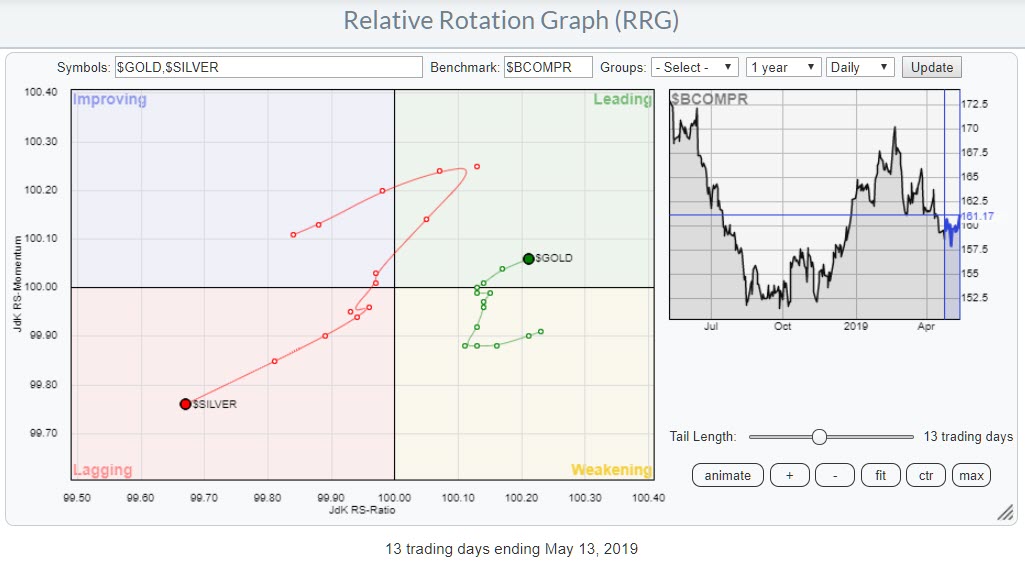
As the Precious Metals group only consists of Gold (75%) and Silver (25%), it makes sense to look at a Relative Rotation Graph of these two commodities against the Precious Metals index ($BCOMPR).
That is done in the chart above. This is a daily chart to highlight the most recent rotation and show the rapid rotation back to the leading quadrant for Gold while Silver is now nose-diving further into the lagging quadrant. It clearly shows that we should have a preference for Gold over Silver for now.
If you open the live version of this RRG you will see that the tail for Silver is generally longer than the tail for Gold and also that Silver makes wider rotations. This is because of the heavy weight of Gold (75%) in that group which drags it closer to the benchmark (center of the RRG) by default.
Gold
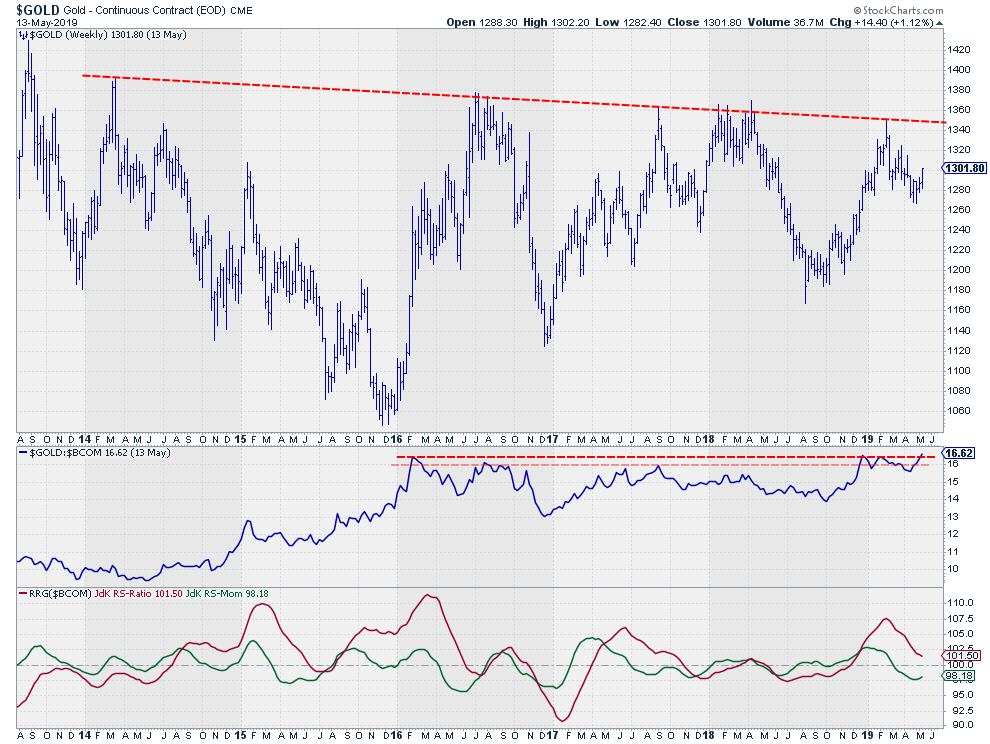
The improvement on the RRG follows the recent improvement of the RS-line of Gold vs $BCOM which is now close to breaking above that horizontal resistance level. When such a break materializes a further relative rally is likely and this will pull the tail for $GOLD back into the leading quadrant without hitting lagging.
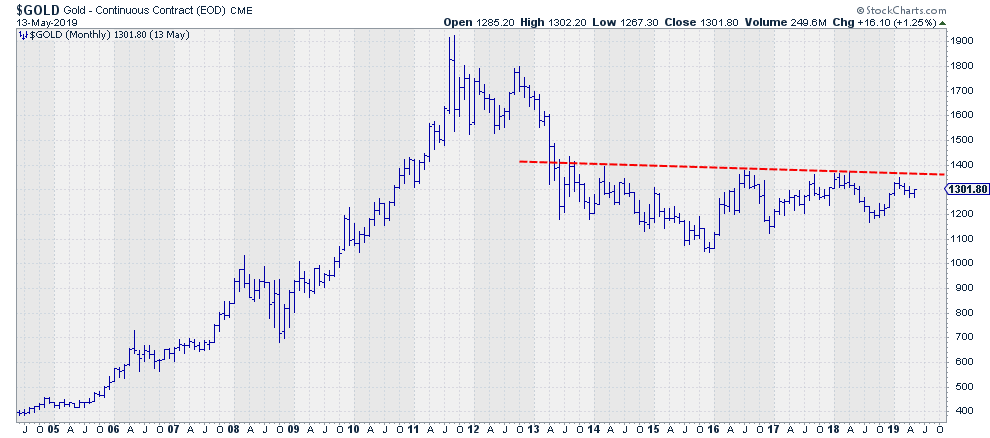
On the price chart, $GOLD still needs to conquer a very heavy overhead resistance level that is marked by the slightly falling trendline connecting the major highs since 2014 and this seems to be a significant level.
It already "looks" heavy on the weekly chart above already but when you zoom out to the monthly chart, that level becomes even more significant.
A break beyond $1400 in Gold will be very significant! As Martin Pring said: A mega resistance.
From A Stockmarket Or Asset Allocation Perspective
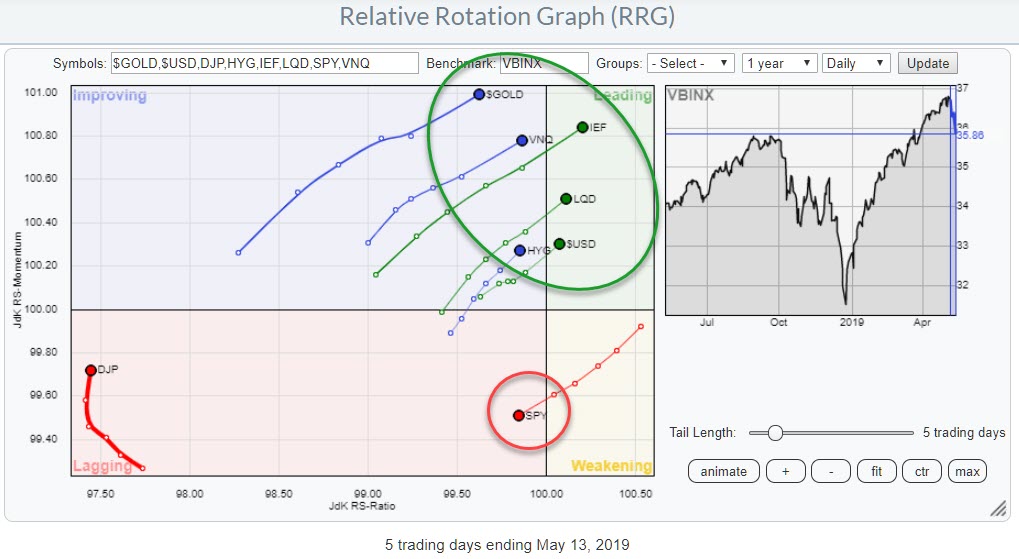
As Gold often serves as a safe haven we should put things into perspective and use a Relative Rotation Graph that shows Asset Class rotation. The chart above is the pre-defined RRG for Asset Classes with $GOLD added to the universe.
It is now the Asset Class with the highest reading on the Jdk RS-Momentum scale and rapidly rotating towards the leading quadrant on the daily time-frame. This visualizes the move out of stocks (SPY) into bond related asset classes and Gold.
For the time being this looks to be the way to go and the preferred positioning for portfolios.
Recently On Twitter
RRG Research
@RRGresearch
· May 11, 2019
Through analysis of relative #momentum and strength, RRGchart visualizes the #trend trajectory of #stockmarkets and thus enables #investors to engage in smart #asset allocation. See how the tradewar is projected to affect the $SPX @StockCharts http://bit.ly/2LBc1gi

S&P Executes Wedge And Rotation To Defensive Sectors Accelerates
Since printing its high on 1 May, the S&P 500 struggled to keep up and make its final push through resistance. In the last three to four days the bulls capitulated and a reinforcement of the 2940-2...
stockcharts.com
Daniel L. Mersebak
@Mersebak
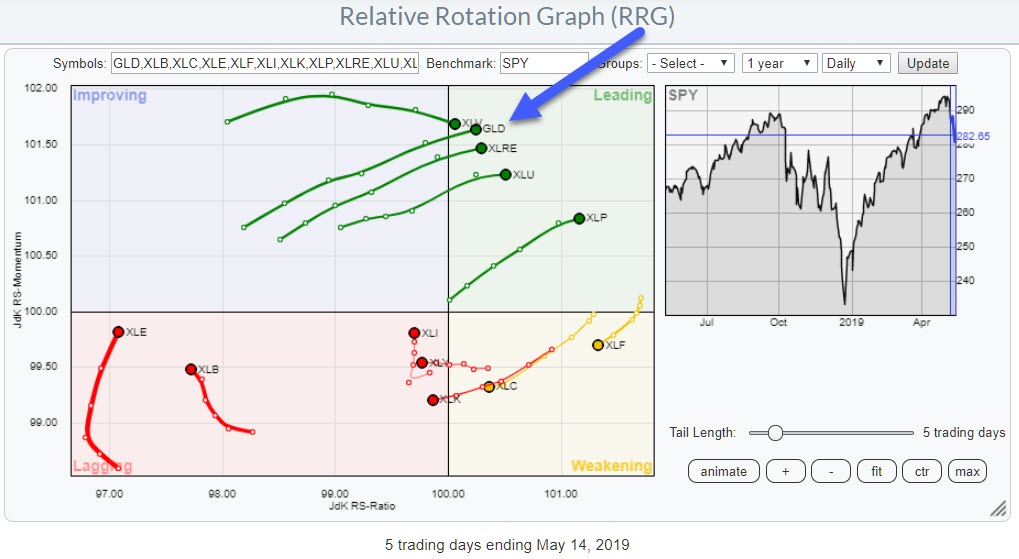
Out of pure curiosity I added GLD to Your collection. Very interesting to see how it fares...Thanks again for a great analysis @RRGresearch @StockCharts pic.twitter.com/kVxlmOecCm
1
3:10 PM - May 11, 2019

See Daniel L. Mersebak's other Tweets
This user added GLD to the predefined universe for US sectors. The position of GLD is right alongside the more defensive sectors and pushing into the leading quadrant, in which they meanwhile have arrived by the way.
Here's the chart with a link to the live version.
Julius de Kempenaer
Read Full Story »»»
• DiscoverGold
Information posted to this board is not meant to suggest any specific action, but to point out the technical signs that can help our readers make their own specific decisions. Your Due Dilegence is a must!
• DiscoverGold
Recent GOLD News
- Barrick Continues to Unlock Value Embedded in Its Asset Base • GlobeNewswire Inc. • 09/17/2024 05:00:29 PM
- Feasibility Study on Lumwana Super Pit Expansion Expected by Year-End • GlobeNewswire Inc. • 09/11/2024 09:00:00 PM
- Key Projects Advance as Barrick Keeps Tight Focus on Value Creation and Growth • GlobeNewswire Inc. • 08/12/2024 10:00:00 AM
- Barrick Declares Q2 Dividend and Buys Back Shares • GlobeNewswire Inc. • 08/12/2024 09:59:00 AM
- U.S. Futures Steady as Markets Await Key Inflation Data, Oil Prices Climb • IH Market News • 08/12/2024 09:47:41 AM
- Mining Plays a Vital Role in Advancing the UN’s Sustainable Development Goals, says Barrick • GlobeNewswire Inc. • 08/02/2024 06:45:39 PM
- Porgera Remains On Track Despite Mulitaka Landslide Challenges • GlobeNewswire Inc. • 07/25/2024 11:00:00 AM
- Higher Q2 Production Puts Barrick On Track to Deliver 2024 Targets • GlobeNewswire Inc. • 07/16/2024 11:00:00 AM
- Barrick Continues to Invest in Mali • GlobeNewswire Inc. • 07/09/2024 07:00:00 PM
- Exploration Success, Capital Investment and Reserve Growth to Sustain Kibali’s Production Profile • GlobeNewswire Inc. • 07/02/2024 04:00:00 PM
- Barrick and Zijin Contribute $1 Million to Support Papua New Guinea Landslide Victims • GlobeNewswire Inc. • 06/07/2024 11:18:39 AM
- Form SD - Specialized disclosure report • Edgar (US Regulatory) • 05/29/2024 08:01:04 PM
- Barrick’s Sustainability Strategy Delivers Real Value to Stakeholders • GlobeNewswire Inc. • 05/15/2024 11:00:00 AM
- Barrick Announces Extensive Exploration Partnership with Geophysx Jamaica • GlobeNewswire Inc. • 05/01/2024 10:15:00 AM
- Barrick to Ramp Up Production As It Remains On Track to Achieve 2024 Targets • GlobeNewswire Inc. • 05/01/2024 10:00:00 AM
- Barrick Declares Q1 Dividend • GlobeNewswire Inc. • 05/01/2024 09:59:00 AM
- Barrick Announces Election of Directors • GlobeNewswire Inc. • 04/30/2024 08:15:55 PM
- Barrick On Track to Achieve 2024 Targets • GlobeNewswire Inc. • 04/16/2024 11:00:00 AM
- Notice of Release of Barrick’s First Quarter 2024 Results • GlobeNewswire Inc. • 04/09/2024 11:00:00 AM
- Strategy-Driven Barrick Builds on Value Foundation • GlobeNewswire Inc. • 03/28/2024 09:20:38 PM
- Barrick Hunts New Gold and Copper Prospects in DRC From Kibali Base • GlobeNewswire Inc. • 03/20/2024 02:00:00 PM
- Barrick Opens Academy at Closed Buzwagi Mine • GlobeNewswire Inc. • 03/18/2024 08:00:00 AM
- Barrick to Grow Production and Value on Global Asset Foundation • GlobeNewswire Inc. • 03/15/2024 11:53:01 AM
- Loulo-Gounkoto Delivers Another Value-Creating Performance • GlobeNewswire Inc. • 03/10/2024 10:00:00 AM
- Passing of the Right Honorable Brian Mulroney • GlobeNewswire Inc. • 03/02/2024 01:17:35 AM
VHAI - Vocodia Partners with Leading Political Super PACs to Revolutionize Fundraising Efforts • VHAI • Sep 19, 2024 11:48 AM
Dear Cashmere Group Holding Co. AKA Swifty Global Signs Binding Letter of Intent to be Acquired by Signing Day Sports • DRCR • Sep 19, 2024 10:26 AM
HealthLynked Launches Virtual Urgent Care Through Partnership with Lyric Health. • HLYK • Sep 19, 2024 8:00 AM
Element79 Gold Corp. Appoints Kevin Arias as Advisor to the Board of Directors, Strengthening Strategic Leadership • ELMGF • Sep 18, 2024 10:29 AM
Mawson Finland Limited Further Expands the Known Mineralized Zones at Rajapalot: Palokas step-out drills 7 metres @ 9.1 g/t gold & 706 ppm cobalt • MFL • Sep 17, 2024 9:02 AM
PickleJar Announces Integration With OptCulture to Deliver Holistic Fan Experiences at Venue Point of Sale • PKLE • Sep 17, 2024 8:00 AM

