


| Followers | 689 |
| Posts | 143817 |
| Boards Moderated | 35 |
| Alias Born | 03/10/2004 |
Wednesday, May 01, 2019 9:14:18 AM
Mixed Rotations For Technology Stocks Inside The Dow - MSFT Comes Out On Top!
By: Julius de Kempenaer | April 30, 2019
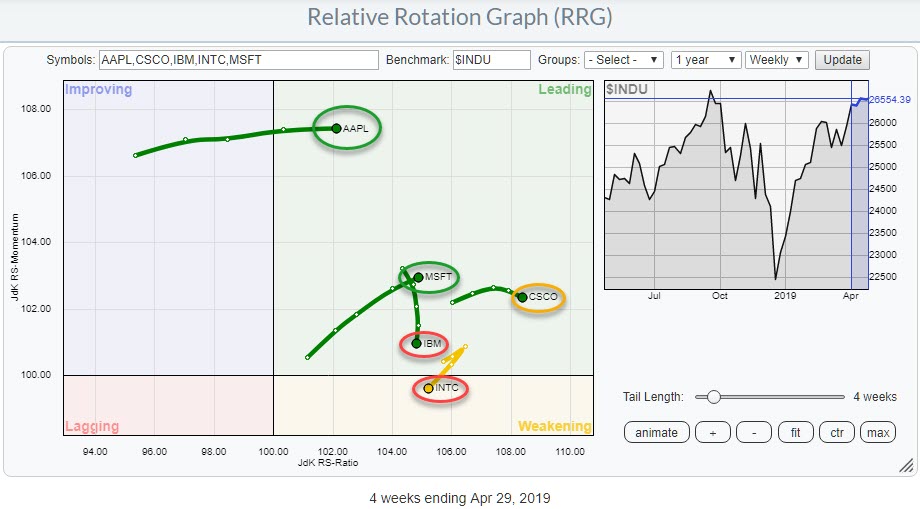
The Relative Rotation Graph shows the five technology stocks inside the DJ Industrials index, all of which are at the right-hand side of the RRG. This is not surprising, considering the strong rotation of the sector as a whole against the S&P 500 index.
Despite the strength of the sector, however, there are a few big differences in the relative strength and the rotation of a few of these individual names.
Intel Corp - INTC
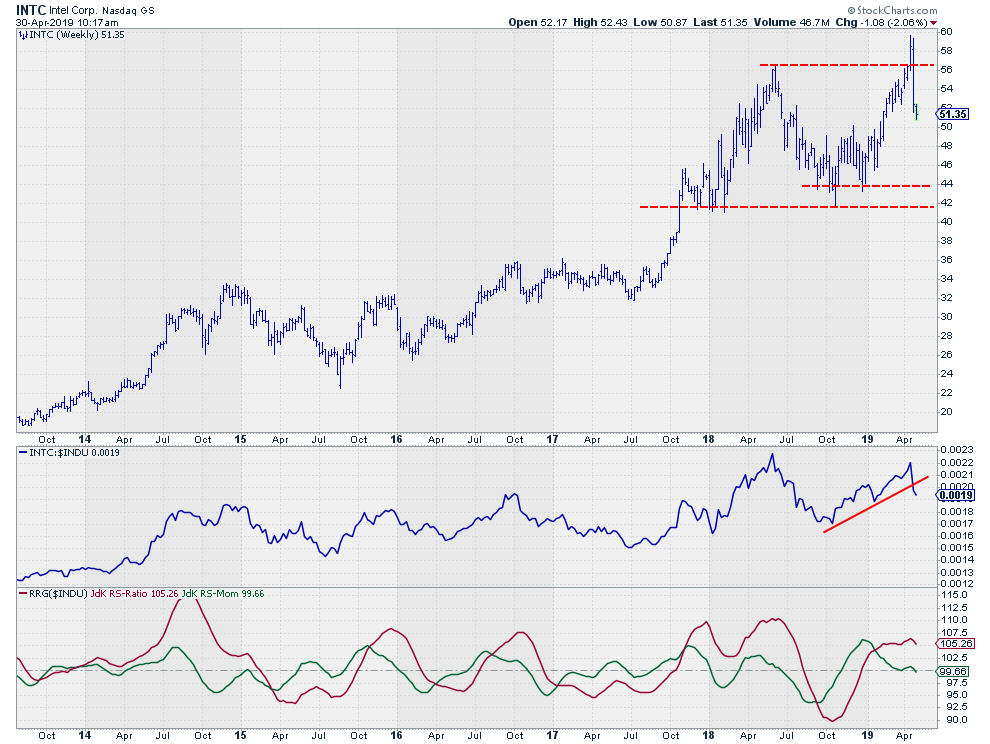
On the RRG above, INTC is crossing over into the weakening quadrant following a sharp rotation down three weeks ago. INTC moved into the leading quadrant at the beginning of the year, but started to roll over quite rapidly, consequently moving lower on the JdK RS-Momentum scale.
This weakening was interrupted very briefly in the first few weeks of April, when INTC hooked right to seemingly get back on track. That was short-lived, however, and the stock is now weakening on both scales and heading towards the lagging quadrant.
Looking at the price chart above, we can see where the "hook" came from. That sharp move was caused by the upward break above INTC's previous high, which was reversed in the week immediately following the break. Such reversals back below the former resistance level are usually not very good signs, often leading to further downward movement.
The emerging uptrend in relative strength gave way as a result of the reversal, pushing the RS-Momentum line back below 100. It is now starting to drag the JdK RS-Ratio line down as well.
Given the failed break and, therefore, the limited upward potential and the big(ger) downside risk, I would advise staying away from Intel for the moment.
International Business Machines - IBM
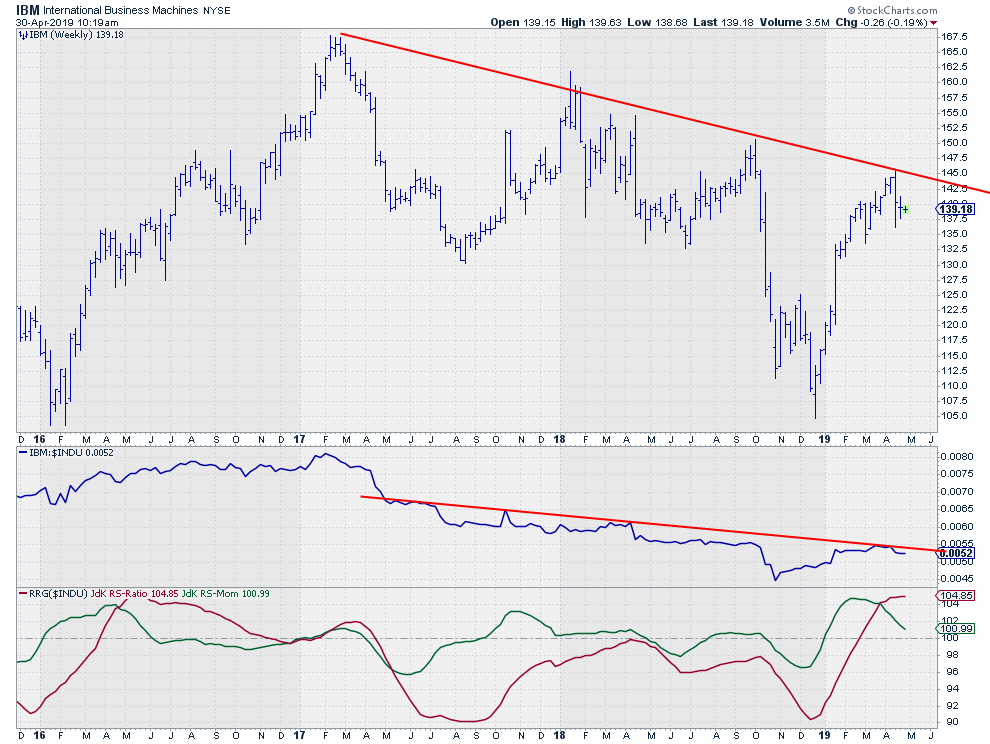
The price chart of IBM is very volatile, which makes it hard to read. Wide swings are never easy when you are looking for trends. In the chart above, the only trend(line) that makes sense, IMHO, is the one drawn across the major highs since early 2017.
That falling resistance line was tested once again a few weeks ago and, once again, it was too heavy to break. The weekly bar for the week that the trend was tested is a nasty reversal bar.
A falling resistance line is also visible in the relative strength chart. Here also, the resistance was too strong. When this relative downtrend started back in April/May 2017, both RRG lines dropped below 100. Until February this year, the RS-Ratio remained below 100 while RS-Momentum had a few oscillations above 100, causing rotations at the left-hand side of the RRG.
The relative up-move out of its 2018 low looks like the early start of a new relative uptrend, pushing both RRG-Lines above 100. However, momentum very rapidly started to roll over, causing the tail to bend down again while inside the leading quadrant. This has been pushing IBM back down towards the weakening quadrant.
It is still possible that relative strength is in a turnaround phase for IBM, but we have seen very little confirmation yet.
With both price and relative strength making another touch-point at a falling resistance line and JdK RS-Momentum heading lower, I still prefer a cautious approach for IBM. The risk for a rotation back to lagging and a continuation of the underperformance against the DJ Industrials is significant.
Cisco Systems - CSCO
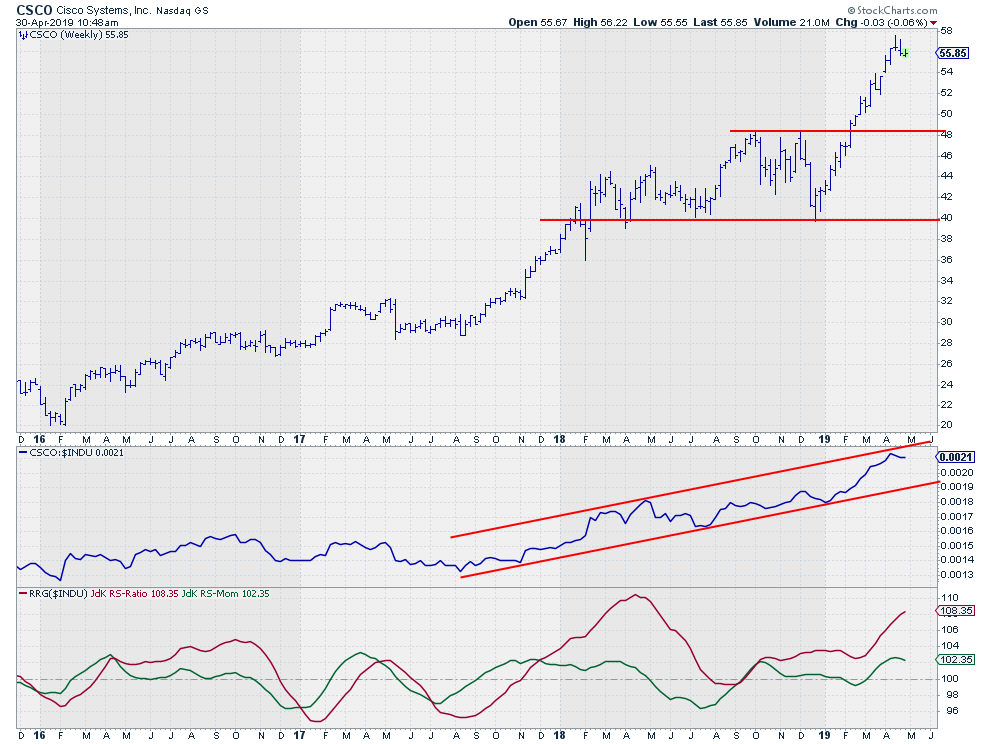
The weekly chart above for CSCO gives no reason for concern. The price trend is strongly up while the relative trend is moving well within the boundaries of a rising channel, causing both RRG-Lines to be comfortably above 100.
The daily picture is slightly less favorable at the moment.
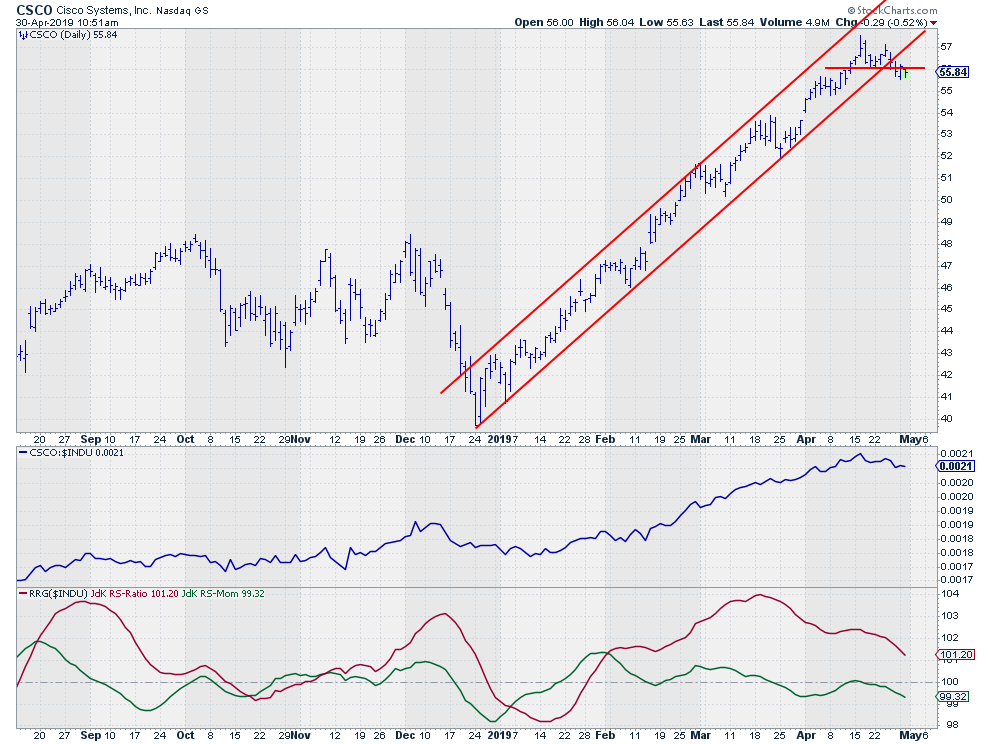
A small double top has been completed, ending the steep up-trending channel out of the December low. At the same time, the relative strength line is rolling over and the RS-Momentum line is already below 100, dragging the RS-Ratio lower towards the 100-level as well.
This puts CSCO inside the weakening quadrant on the daily RRG.
Given the steep rise, a scenario in which we will see some consolidation or corrective movement for CSCO before it resumes its relative uptrend is likely.
Apple Inc - AAPL
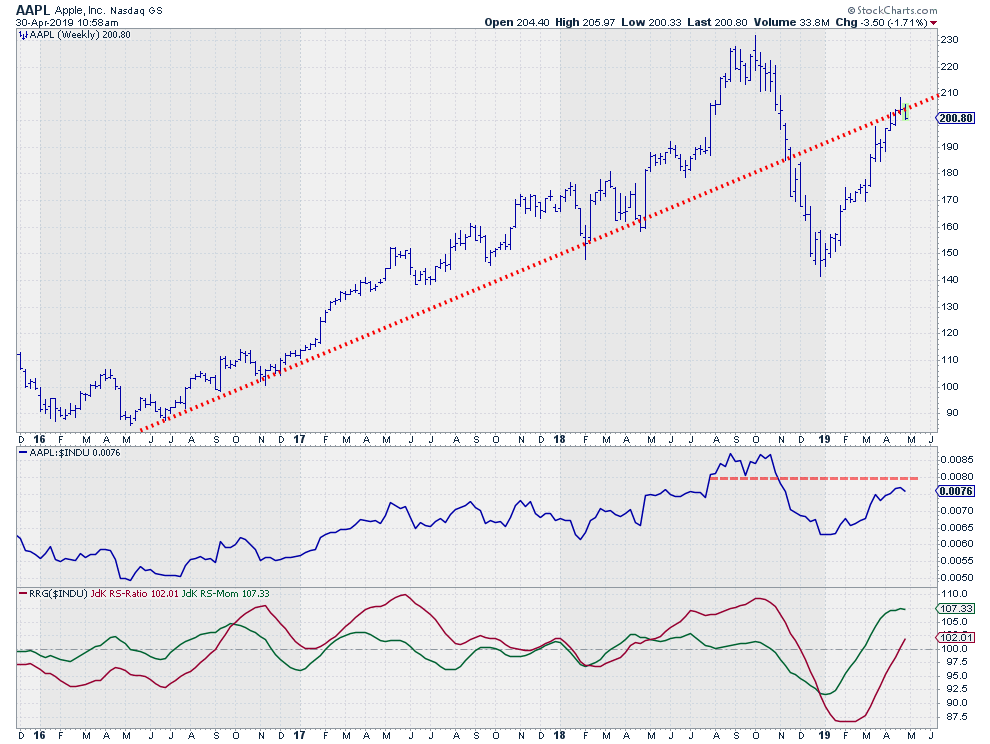
On the Relative Rotation Graph, AAPL is the stock with the highest RS-Momentum reading. But it has been at a flat RS-ratio level already for three to four weeks. This makes a continuation of this rotation questionable at this point in time.
The rally out of the December low was impressive, but it looks as if the old support line is now coming back into play as resistance. Just like CSCO, the weekly chart is still okay-ish, but, on the daily chart, a small reversal is in place, which suggests at least some short-term weakness.
For AAPL also, the daily chart and rotation suggest some weakness ahead before a potential resumption of the uptrend in play on the weekly charts.
Microsoft Corp - MSFT
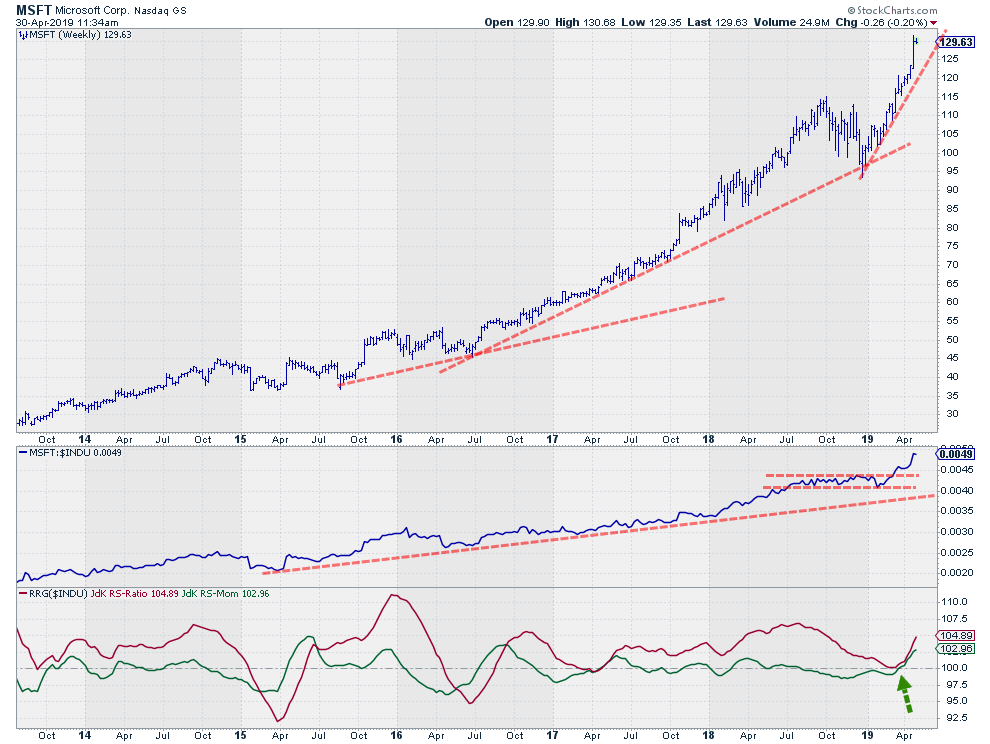
Out of these five tech stocks inside the DJ Industrials index, the clear winner, for now, is Microsoft.
The weekly chart above shows a fantastic uptrend in price that is getting steeper every few months. How long can this go on? I have no idea but, for now, it would not be a smart move to swim against the tide on this one.
Despite a small rotation through lagging in 2016, MSFT has predominantly been rotating at the right-hand side of the RRG since June 2016. After the recent move through weakening (RS-Momentum below 100 and RS-Ratio above 100), MSFT just jumped back into leading after "hugging" the 100-level on RS-Ratio but not crossing over.
The current strength of MSFT can also be seen really well when you put the weekly and the daily RRG side by side, as shown below.
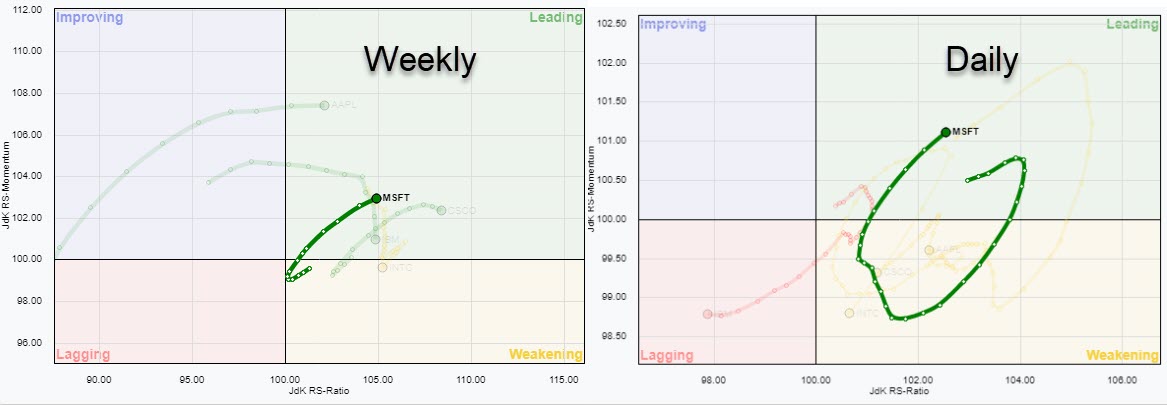
Both tails are well inside the leading quadrant. Both entered that leading quadrant from the weakening, which usually signals a continuation of the existing relative uptrend trend following a short retracement.
This makes MSFT the preferred tech stock with the least downside risk within the Dow Industrials, for the time being.
Julius de Kempenaer
Senior Technical Analyst, StockCharts.com
Read Full Story »»»
• DiscoverGold
Information posted to this board is not meant to suggest any specific action, but to point out the technical signs that can help our readers make their own specific decisions. Your Due Dilegence is a must!
• DiscoverGold
Join the InvestorsHub Community
Register for free to join our community of investors and share your ideas. You will also get access to streaming quotes, interactive charts, trades, portfolio, live options flow and more tools.

