


| Followers | 680 |
| Posts | 141194 |
| Boards Moderated | 36 |
| Alias Born | 03/10/2004 |
Monday, April 29, 2019 9:25:57 AM
The Biggest Risk to Big-Cap Tech Stocks
By: Schaeffer's Investment Research | April 29, 2019
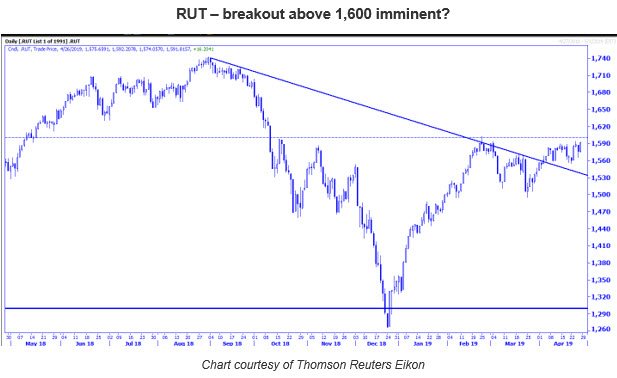
Short interest could help the RUT overcome round-number resistance
"History suggests that a run through 2,900 and back to the September intraday high of 2,940 is imminent. Since 1950, in the 11 instances in which the SPX experienced at least a 20% decline from intraday high to intraday low, as it did in the fourth quarter, and then rallied back to within 2% of its intraday high, which occurred on Friday when the SPX closed above 2,882.09, the previous intraday high was touched on nine of those occasions within 33 calendar days."
-- Monday Morning Outlook, April 8, 2019
The S&P 500 Index (SPX - 2,939.88) staged another rally last week and remains on target to touch 2,940.91, its 2018 intraday high, by May 8. May 8 is the 33-day mark after getting to within 2% of this level on April 5, following a 20% pullback from intraday high to low. In fact, last week's close marked the SPX's all-time closing high of 2,939.88, and the index comes into this week only 2 points shy of making it 10 of 12, with respect to the pattern observed in the excerpt above.
While the Russell 2000 Index (RUT - 1,591.81) is still slightly outperforming the SPX in 2019, it remains stuck below the round 1,600 century mark, where it has been experiencing resistance since late February. The RUT is still 8.5% below its August 2018 closing high of 1,740.75, with the closing lows since mid-April occurring in the 1,566 area, or 10% below the August closing high, as it continues to trade in a narrow range.
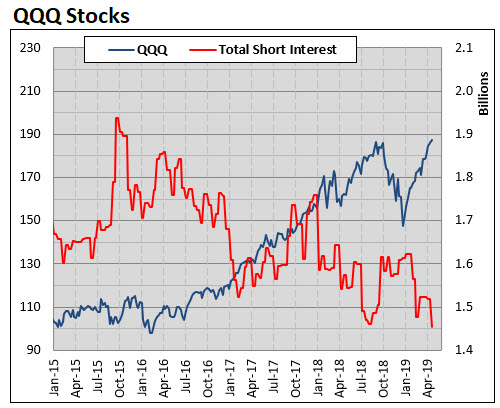
While 1,600 continue to act as resistance, a bullish factor for the RUT is that it is trading above a trendline marking lower highs, suggesting a breakout above 1,600 is imminent. Moreover, unlike Invesco QQQ Trust (QQQ - 190.65) and SPX components, short interest on RUT components remains high and is a source of fuel to push the RUT above 1,600 in the coming weeks. I will discuss the QQQ and SPX short interest situation later in the commentary.
"Technicians are likely focused on the QQQ, which enters the week at a level from which a significant sell-off occurred in the fourth quarter of 2018, and 30% above the December closing low…Bulls would like to see a breakout, of course, but will likely be satisfied if the QQQ consolidates in the short term. After all, as it trades at an obvious potential resistance level, it too is overbought, per the 75 reading on its 14-day Relative Strength Index (RSI). Moreover, the IXIC is trading right around the 8,000-millennium area, and round numbers can sometimes act as major speed bumps or reversal areas."
-- Monday Morning Outlook, April 22, 2019
The star of the show in 2019 is technology stocks. The Nasdaq Composite (IXIC - 8,146.39) is up 22% in 2019, and the QQQ exchange-traded fund (ETF) is higher by 23%. The IXIC is in a similar technical situation as the SPX, as it comes into this week around its all-time high. But the IXIC is now comfortably above the 8,000-millennium mark and broke out to new all-time highs last week. The strong performance of this group remains an interesting story line, as fund managers, who are heavy cash, may look to deploy this cash into outperforming equities, such as technology.
"With the SPX up 12.5% YTD as of mid-March, short interest increased 3% during this period. Many of these freshly added positions are likely underwater, and an unwinding of this trade could be another source of fuel in the weeks ahead."
-- Monday Morning Outlook, April 8, 2019
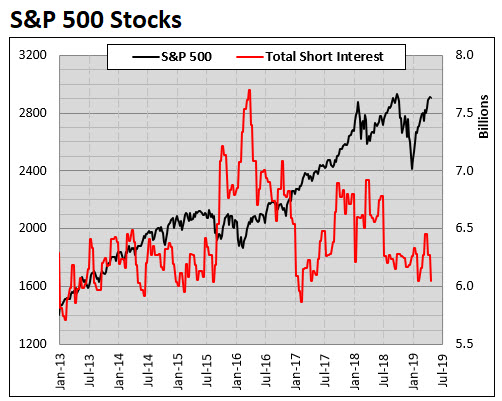
Earlier this month, I highlighted the fact that despite strong price action in the equity market, some traders and investors were expressing signs of caution, or downright skepticism, by placing bets against stocks. For example, I noted that SPX component short interest was rising, and fund investors had been slow to come back into the market after heavy selling in the fourth quarter 2018.
Despite the equity market advancing over the past month, weekly data from Lipper shows that sentiment among fund investors is even more cautious, as there have been net outflows from equity funds. However, the shorts are showing signs of feeling pain, particularly on SPX and components of the tech-laden QQQ, as short interest has dropped again to two-year and multi-year lows, respectively. Per the excerpt above, I anticipated that short covering could be a source of fuel in the short term, as we know the shorts were in losing positions and more apt to cover than add to their bets. Bulls may have enjoyed the ride, but it is one source of fuel that has dissipated during the past few weeks.
The short-covering that has taken place now becomes a risk factor for bulls, particularly on big-cap technology names. But there are additional sources of potential demand, such as sideline money viewing the breakout in the QQQ as permission to invest in these names.
The price action supports taking long positions in these names, but with the short-covering dissipating, we strongly urge using call options to manage the risk. Or, if you are holding large-cap technology stocks, use put options to protect those positions.
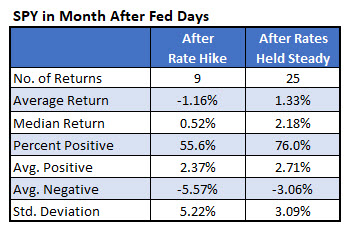
Looking ahead, this week the Federal Open Market Committee (FOMC) is set to meet, and fed funds futures traders are implying a 97.5% probability that the Fed holds interest rates steady, just like the last meeting on March 20. As expected, the market rallied in the one month following the March 20 meeting, and is expected to do so once again if indeed the Fed holds rates steady.
Per the table below, since the rate-tightening cycle began in December 2015, the deck is stacked in favor of the bulls in the month following decisions to hold rates steady. For what it is worth, after the Fed held rates steady at their its meeting on March 20, the SPX rallied 2.8%, just above the median return of 2.2%.
Read Full Story »»»
• DiscoverGold
By: Schaeffer's Investment Research | April 29, 2019
Short interest could help the RUT overcome round-number resistance
"History suggests that a run through 2,900 and back to the September intraday high of 2,940 is imminent. Since 1950, in the 11 instances in which the SPX experienced at least a 20% decline from intraday high to intraday low, as it did in the fourth quarter, and then rallied back to within 2% of its intraday high, which occurred on Friday when the SPX closed above 2,882.09, the previous intraday high was touched on nine of those occasions within 33 calendar days."
-- Monday Morning Outlook, April 8, 2019
The S&P 500 Index (SPX - 2,939.88) staged another rally last week and remains on target to touch 2,940.91, its 2018 intraday high, by May 8. May 8 is the 33-day mark after getting to within 2% of this level on April 5, following a 20% pullback from intraday high to low. In fact, last week's close marked the SPX's all-time closing high of 2,939.88, and the index comes into this week only 2 points shy of making it 10 of 12, with respect to the pattern observed in the excerpt above.
While the Russell 2000 Index (RUT - 1,591.81) is still slightly outperforming the SPX in 2019, it remains stuck below the round 1,600 century mark, where it has been experiencing resistance since late February. The RUT is still 8.5% below its August 2018 closing high of 1,740.75, with the closing lows since mid-April occurring in the 1,566 area, or 10% below the August closing high, as it continues to trade in a narrow range.
While 1,600 continue to act as resistance, a bullish factor for the RUT is that it is trading above a trendline marking lower highs, suggesting a breakout above 1,600 is imminent. Moreover, unlike Invesco QQQ Trust (QQQ - 190.65) and SPX components, short interest on RUT components remains high and is a source of fuel to push the RUT above 1,600 in the coming weeks. I will discuss the QQQ and SPX short interest situation later in the commentary.

"Technicians are likely focused on the QQQ, which enters the week at a level from which a significant sell-off occurred in the fourth quarter of 2018, and 30% above the December closing low…Bulls would like to see a breakout, of course, but will likely be satisfied if the QQQ consolidates in the short term. After all, as it trades at an obvious potential resistance level, it too is overbought, per the 75 reading on its 14-day Relative Strength Index (RSI). Moreover, the IXIC is trading right around the 8,000-millennium area, and round numbers can sometimes act as major speed bumps or reversal areas."
-- Monday Morning Outlook, April 22, 2019
The star of the show in 2019 is technology stocks. The Nasdaq Composite (IXIC - 8,146.39) is up 22% in 2019, and the QQQ exchange-traded fund (ETF) is higher by 23%. The IXIC is in a similar technical situation as the SPX, as it comes into this week around its all-time high. But the IXIC is now comfortably above the 8,000-millennium mark and broke out to new all-time highs last week. The strong performance of this group remains an interesting story line, as fund managers, who are heavy cash, may look to deploy this cash into outperforming equities, such as technology.
"With the SPX up 12.5% YTD as of mid-March, short interest increased 3% during this period. Many of these freshly added positions are likely underwater, and an unwinding of this trade could be another source of fuel in the weeks ahead."
-- Monday Morning Outlook, April 8, 2019
Earlier this month, I highlighted the fact that despite strong price action in the equity market, some traders and investors were expressing signs of caution, or downright skepticism, by placing bets against stocks. For example, I noted that SPX component short interest was rising, and fund investors had been slow to come back into the market after heavy selling in the fourth quarter 2018.
Despite the equity market advancing over the past month, weekly data from Lipper shows that sentiment among fund investors is even more cautious, as there have been net outflows from equity funds. However, the shorts are showing signs of feeling pain, particularly on SPX and components of the tech-laden QQQ, as short interest has dropped again to two-year and multi-year lows, respectively. Per the excerpt above, I anticipated that short covering could be a source of fuel in the short term, as we know the shorts were in losing positions and more apt to cover than add to their bets. Bulls may have enjoyed the ride, but it is one source of fuel that has dissipated during the past few weeks.
The short-covering that has taken place now becomes a risk factor for bulls, particularly on big-cap technology names. But there are additional sources of potential demand, such as sideline money viewing the breakout in the QQQ as permission to invest in these names.
The price action supports taking long positions in these names, but with the short-covering dissipating, we strongly urge using call options to manage the risk. Or, if you are holding large-cap technology stocks, use put options to protect those positions.


Looking ahead, this week the Federal Open Market Committee (FOMC) is set to meet, and fed funds futures traders are implying a 97.5% probability that the Fed holds interest rates steady, just like the last meeting on March 20. As expected, the market rallied in the one month following the March 20 meeting, and is expected to do so once again if indeed the Fed holds rates steady.
Per the table below, since the rate-tightening cycle began in December 2015, the deck is stacked in favor of the bulls in the month following decisions to hold rates steady. For what it is worth, after the Fed held rates steady at their its meeting on March 20, the SPX rallied 2.8%, just above the median return of 2.2%.

Read Full Story »»»
• DiscoverGold
Information posted to this board is not meant to suggest any specific action, but to point out the technical signs that can help our readers make their own specific decisions. Your Due Dilegence is a must!
• DiscoverGold
Join the InvestorsHub Community
Register for free to join our community of investors and share your ideas. You will also get access to streaming quotes, interactive charts, trades, portfolio, live options flow and more tools.

