


| Followers | 689 |
| Posts | 143817 |
| Boards Moderated | 35 |
| Alias Born | 03/10/2004 |
Wednesday, March 13, 2019 9:50:21 AM
S&P 500 Sectors Long And Short Of Short Interest
By: Hedgopia | March 12, 2019
Here is a brief review of period-over-period change in short interest in the February 19-28 period in 10 S&P 500 sectors.
XLB (SPDR materials ETF)
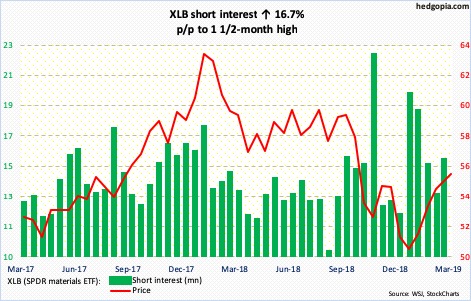
Two weeks ago, XLB (55.51) was rejected at 56. This resistance goes back a couple of years. On the weekly, there is room for continued unwinding of overbought conditions. On the daily, however, bulls have a shot at that level again. The 200-day moving average (55.95) lies around there as well. The ETF has not been above the average since late September last year.
XLE (SPDR energy ETF)
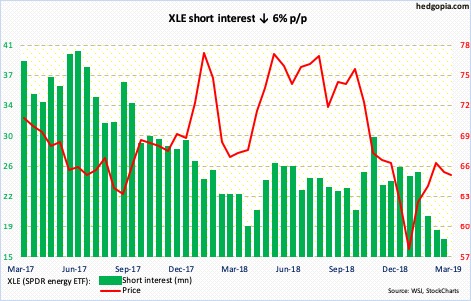
Last Friday, XLE (64.90) found support at the 50-day, even though the week produced a bearish engulfing candle. In the past three weeks, the ETF was denied twice at just under 67. A test of that level is the best bulls can hope for near term. Shorts continue to cut back, and the weekly chart remains way extended.
XLF (SPDR financial ETF)
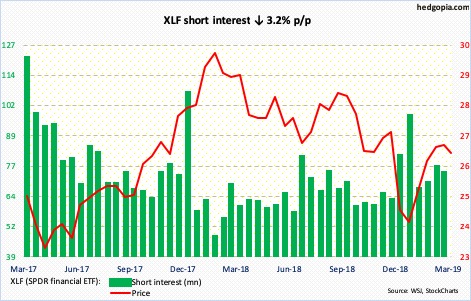
XLF (26.24) remains trapped between the 50- and 200-day. Several times over the past couple of weeks, the latter rejected breakout attempts, even as the 50-day was just about tested last Friday – successfully. It needs to break one way or the other before a new trend is established.
XLI (SPDR industrial ETF)
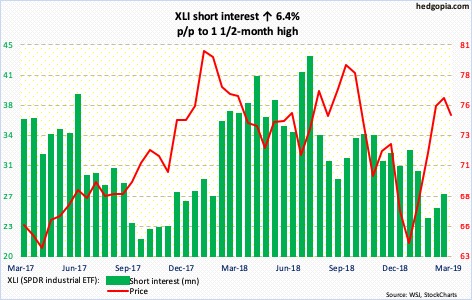
XLI (74.90) bulls defended the 200-day on Monday. Shorter-term averages are rolling over. Shorts added a tad in February – but not enough to cause a major squeeze..That said, they may be forced to rethink their bias near term should the ETF rally past 77-plus. On the weekly, several momentum indicators have turned lower.
XLK (SPDR technology ETF)
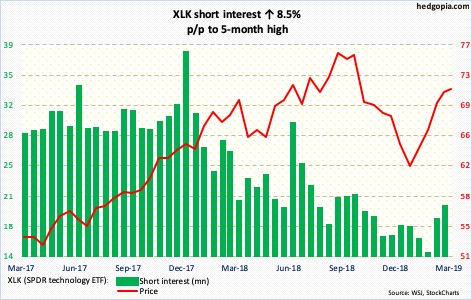
Last week’s bearish engulfing candle was preceded by a hanging man on XLK (71.31). Bulls are not giving up that easy, though. After losing the 200-day intraday last Friday, this week started out strong with a 2.2-percent rally Monday – firmly back above the average. For continued momentum, they need to take out last week’s high of 71.82, which approximates the daily upper Bollinger band.
XLP (SPDR consumer staples ETF)
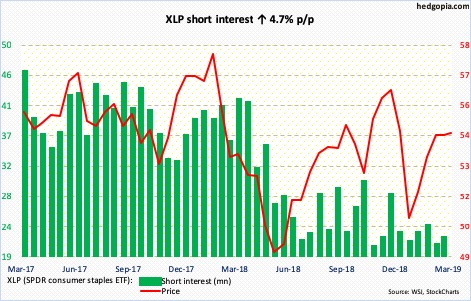
Shorts continue to lie low. Mid-February, XLP’s (54.41) rally from late December stopped at a declining trend line from early November last year. In the subsequent selloff, the 200-day was just about tested last Friday. Monday’s 1.3-percent jump places the ETF right at that trend line. A breakout opens the door for a test of trend-line resistance from early January last year around 56.
XLRE (SPDR real estate ETF)
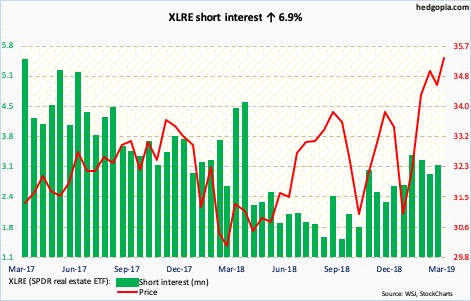
After getting denied at just south of 35 that made up the upper bound of a two-and-a-half-year rectangle, XLRE (35.36) bulls finally forced a breakout. If it is genuine, technicians in due course would be eyeing 40. Shorts have been gradually adding in the past several months. Should they start to cover, it will at least provide some tailwind.
XLU (SPDR utilities ETF)
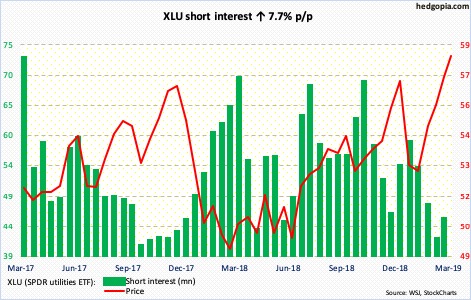
XLU (57.96) has traded all along the rising 10-day for nearly two months now. It just busted through major resistance just north of 57. As overbought as the ETF is, bulls are yet to lose momentum. For now, shorts have decided not to press.
XLV (SPDR healthcare ETF)
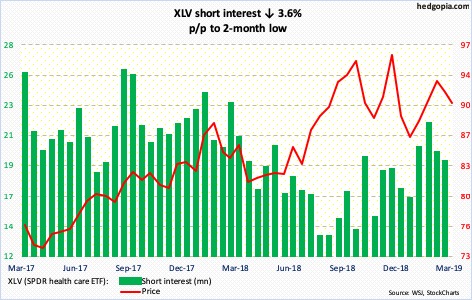
XLV (90.42) came under pressure after sellers showed up Monday last week at the daily upper Bollinger band. The five-plus-percent drop since saw the ETF lose the 200-day intraday last Friday. The average was further defended in Monday’s 1.1-percent rally. Recapturing of 91.50s opens the door for a test of 93.50s. Shorts can help in this scenario.
XLY (SPDR consumer discretionary ETF)
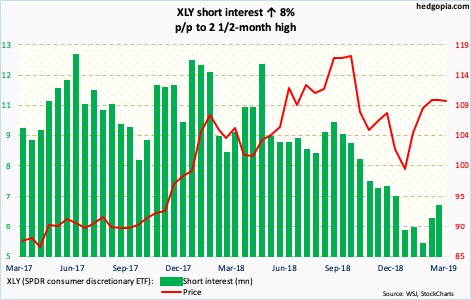
XLY (109.90) shorts added in February, but short interest still remains subdued – not much to cause a major squeeze. Bulls will have to do the heavy lifting themselves. Last Friday, they showed up at the daily lower Bollinger band, followed by Monday’s 1.4-percent rally past the 200-day. There is decent resistance at 112.
Read Full Story »»»
• DiscoverGold
Information posted to this board is not meant to suggest any specific action, but to point out the technical signs that can help our readers make their own specific decisions. Your Due Dilegence is a must!
• DiscoverGold
Join the InvestorsHub Community
Register for free to join our community of investors and share your ideas. You will also get access to streaming quotes, interactive charts, trades, portfolio, live options flow and more tools.

