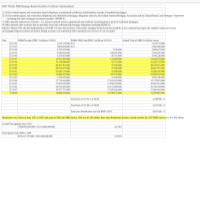
“Exhibit A... Duff & Phelps, LLC as of March 31, 2017”
If you add up the two entries under LBMLT 2000-1 group 1 + LBMLT 2000-1 group 2
Orginal Group Collatetal Balance = $72,998,895 + $927,001,700 = $1,000,000,595
Group Losses to Date = $6,732,021 + $69,500,512 = $76,232,533
Total Group Losses percentage rate = $76,232,533 / $1,000,000,595 = 0.07623 = 7.623% group losses
___________________
IMO...my conclusions as of February 25, 2019:
1) Per the DB document as of February 21, 2019, has a much less realized loss of $24,570,505.25 (2.457%) instead of the Duff & Phelps document (as of March 31, 2017) which stated losses of $76,232,533 (7.623%)
And total profit (ROI) = 18.567%
2) I compared LBMLT 2001-2 on the two separate documents and it yielded the same results. Which means that the Duff & Phelps document overestimated losses compared to the actual realized losses.
3) I haven’t compared all the other Long Beach MBS Trusts, but I assume they will yield the same conclusions.
4) Therefore, per the Duff & Phelps as of March 31, 2017, it stated that total “Group Losses to Date” = $16,673,212,335 (PDF page 204 of 108), which is approximately a 16% loss rate of all Long Beach Mortgage MBS Trusts. IMO...I contend that the actual realized losses are significantly less!


 Market Data
  Markets


 AI
AI