


| Followers | 689 |
| Posts | 143817 |
| Boards Moderated | 35 |
| Alias Born | 03/10/2004 |
Sunday, December 09, 2018 8:54:12 AM
DP (SPY) Weekly Wrap: Still In Trading Range Despite Fireworks
By: Carl Swenlin | December 7, 2018
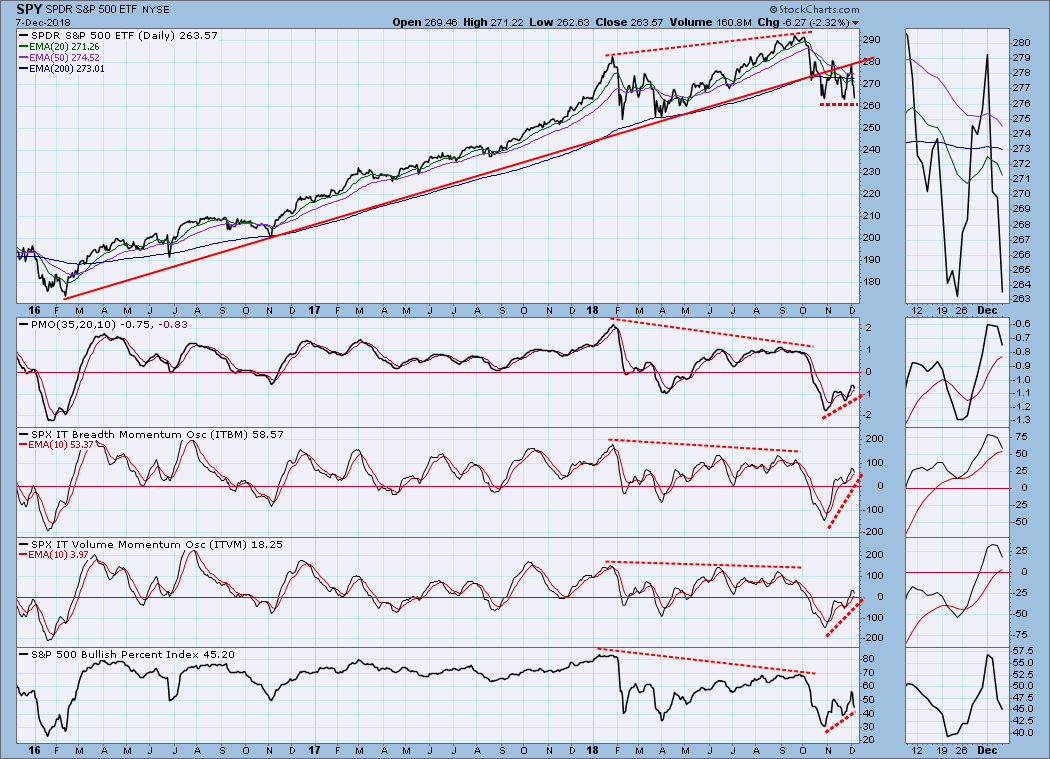
There will probably be a lot of people mentioning that today there was a "Death Cross" on the S&P 500 chart, and this is important because a Death Cross means that the price index has entered a bear market. Specifically, on the $SPX chart (not shown) the 50-day simple moving average crossed down through the 200-day simple moving average (SMA). I don't use SMAs because I believe exponential moving averages (EMAs) behave more rationally. And for signal generation and trading decisions I track SPY instead of $SPX, which can actually be traded. Also, like stocks, SPY is adjusted for distributions, which reflects the total return of the index. As you can see on my chart, there has been no 50/200EMA downside crossover yet. I think that it is inevitable, but it could quickly be avoided if SPY were to rally above the EMAs, because that would cause the EMAs to turn up and begin separating again. That wouldn't necessarily happen with an SMA because of the way they are calculated.

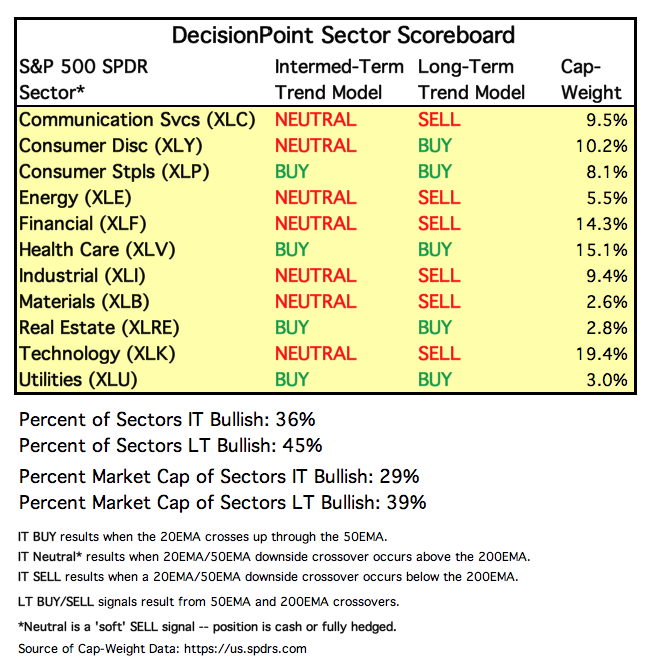
SECTORS
Each S&P 500 Index component stock is assigned to one, and only one, of 11 major sectors. This is a snapshot of the Intermediate-Term and Long-Term Trend Model signal status for those sectors.
STOCKS
IT Trend Model: NEUTRAL as of 10/15/2018
LT Trend Model: BUY as of 4/1/2016
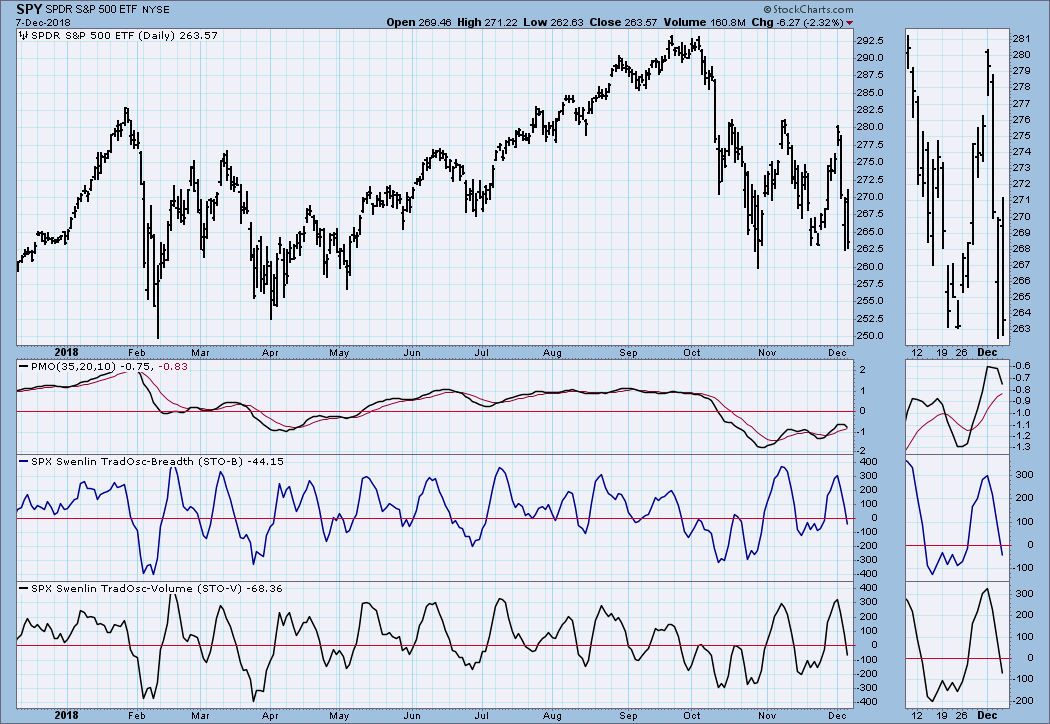
SPY Daily Chart: In addition to my comments in the opening paragraph, there are a few more things worth mentioning. Price remains in a trading range that is nearly two months long and 7% deep. This is referred to as a continuation pattern, which means that price is consolidating prior to resuming the down trend. In the shorter-term, note that volume contracted on today, which could mean that selling has been exhausted.
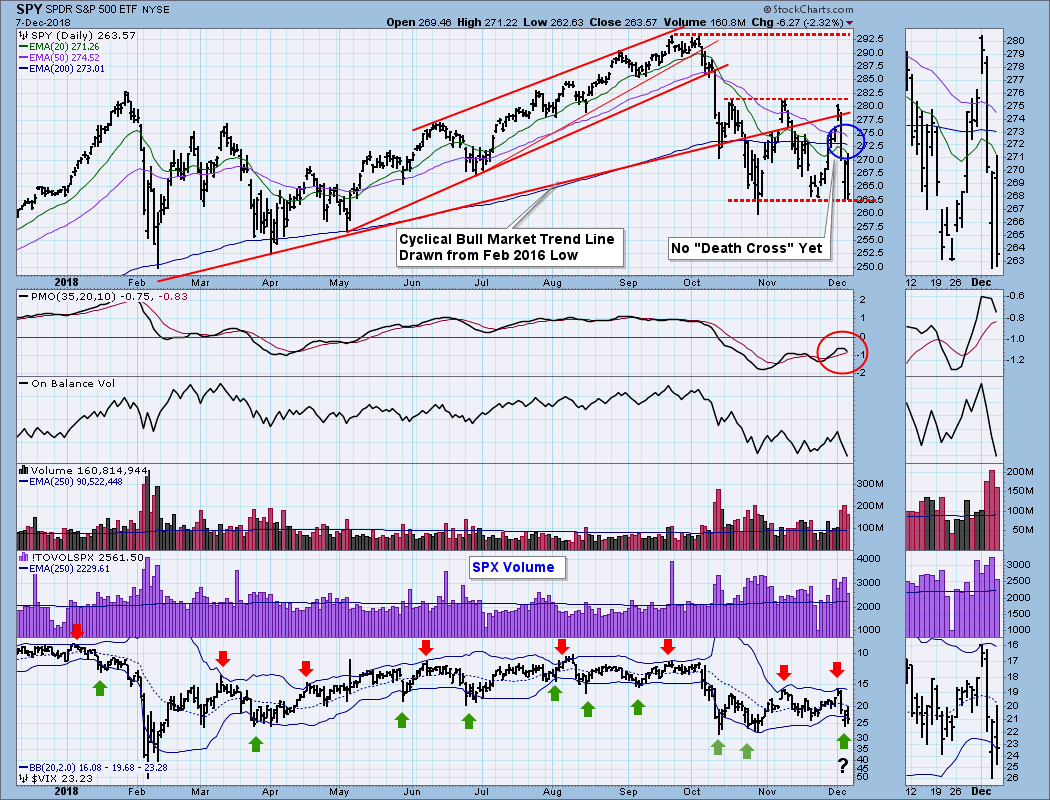
The bottom panel on the above chart is the VIX (inverted). When the VIX touches or penetrates either Bollinger Band, it should alert us to expect a price reversal soon. There are exceptions, like in January/February and again in October. After a period when the bands narrowed, the VIX made contact with the lower band and pushed it significantly lower. This week we see a similar setup, but I have put a question mark under the last green arrow because, considering recent market action, we need to be alert for possibly another "push down" caused by more selling.
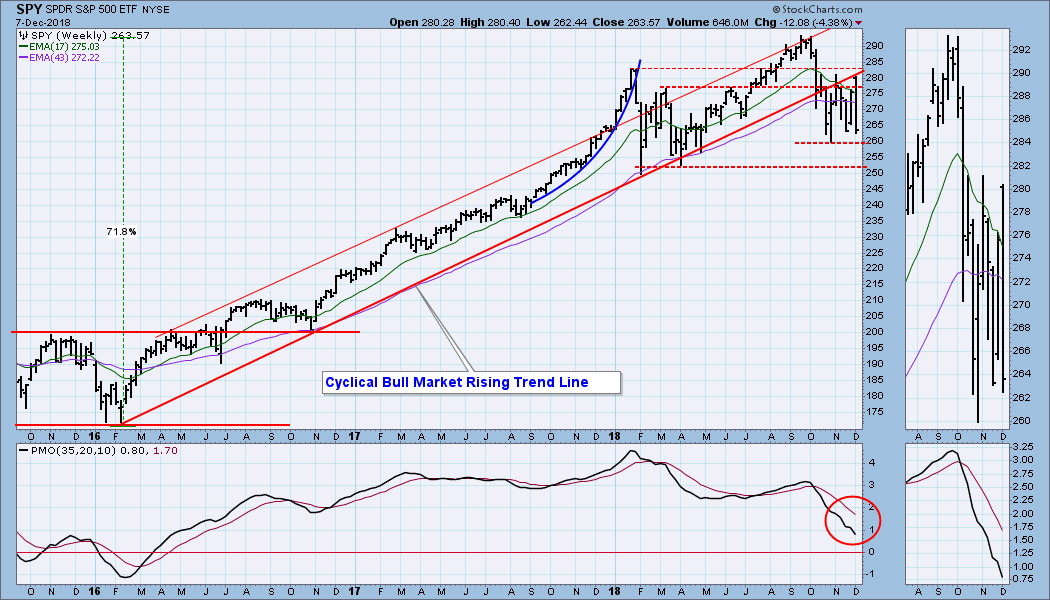
SPY Weekly Chart: While the cyclical bull market rising trend line has been broken, SPY did not continue the decline, but has been consolidating for weeks.
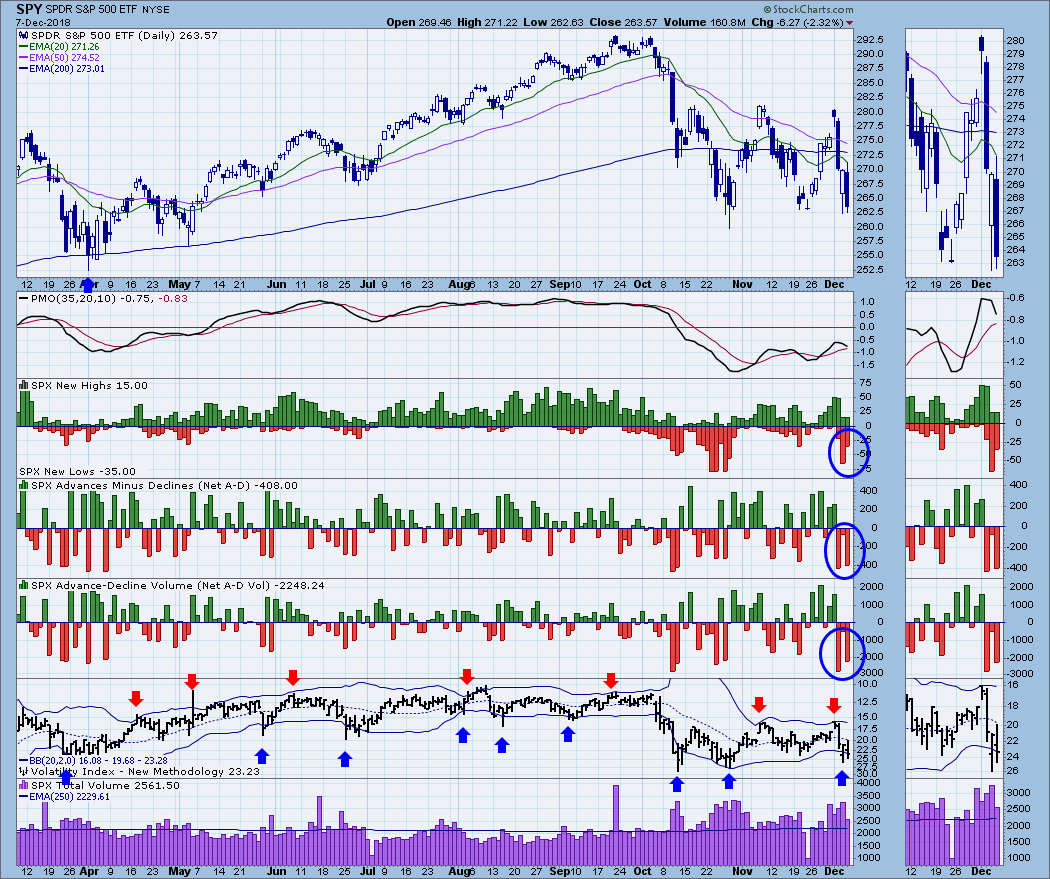
ULTRA-Short-Term Market Indicators: Note that Friday's readings contracted relative to down spikes earlier this week.
Short-Term Market Indicators: The STO-B and STO-V are neutral, but they are low enough to be considered oversold. If the bear persists next week, they will go lower.
Intermediate-Term Market Indicators: The positive divergences abound, but keep in mind that sideways price movement has permitted these indicators to work their way back to the neutral zone. Instead of a rally from oversold lows to new, all-time highs, we got furious sideways chop.
CONCLUSION: It has really been an interesting two months (interesting as in the Chinese proverb). The market has declined about -11% from the September top, but most of the time, about two months, has been spent in a trading range. Trading ranges can be boring, but the problem with this one is that it is very wide -- about 7% between the top and bottom, which is a lot of real estate to traverse in the sharp price swings we have experienced. This week was probably the worst.
Once again we are at the bottom of the trading range and wondering if the bottom will hold. Being in a bear market, I have to assume that sooner or later we're headed lower. The ultra-short-term indicators allow for a little bounce next week. The intermediate-term indicators have cleared their oversold conditions of over a month ago, so they could accommodate more selling. Since I believe we're in a bear market, I expect the market is headed lower, although the path it takes will probably prove to be "interesting."
Read More »»»
• DiscoverGold
By: Carl Swenlin | December 7, 2018
There will probably be a lot of people mentioning that today there was a "Death Cross" on the S&P 500 chart, and this is important because a Death Cross means that the price index has entered a bear market. Specifically, on the $SPX chart (not shown) the 50-day simple moving average crossed down through the 200-day simple moving average (SMA). I don't use SMAs because I believe exponential moving averages (EMAs) behave more rationally. And for signal generation and trading decisions I track SPY instead of $SPX, which can actually be traded. Also, like stocks, SPY is adjusted for distributions, which reflects the total return of the index. As you can see on my chart, there has been no 50/200EMA downside crossover yet. I think that it is inevitable, but it could quickly be avoided if SPY were to rally above the EMAs, because that would cause the EMAs to turn up and begin separating again. That wouldn't necessarily happen with an SMA because of the way they are calculated.

SECTORS
Each S&P 500 Index component stock is assigned to one, and only one, of 11 major sectors. This is a snapshot of the Intermediate-Term and Long-Term Trend Model signal status for those sectors.

STOCKS
IT Trend Model: NEUTRAL as of 10/15/2018
LT Trend Model: BUY as of 4/1/2016
SPY Daily Chart: In addition to my comments in the opening paragraph, there are a few more things worth mentioning. Price remains in a trading range that is nearly two months long and 7% deep. This is referred to as a continuation pattern, which means that price is consolidating prior to resuming the down trend. In the shorter-term, note that volume contracted on today, which could mean that selling has been exhausted.

The bottom panel on the above chart is the VIX (inverted). When the VIX touches or penetrates either Bollinger Band, it should alert us to expect a price reversal soon. There are exceptions, like in January/February and again in October. After a period when the bands narrowed, the VIX made contact with the lower band and pushed it significantly lower. This week we see a similar setup, but I have put a question mark under the last green arrow because, considering recent market action, we need to be alert for possibly another "push down" caused by more selling.
SPY Weekly Chart: While the cyclical bull market rising trend line has been broken, SPY did not continue the decline, but has been consolidating for weeks.

ULTRA-Short-Term Market Indicators: Note that Friday's readings contracted relative to down spikes earlier this week.

Short-Term Market Indicators: The STO-B and STO-V are neutral, but they are low enough to be considered oversold. If the bear persists next week, they will go lower.

Intermediate-Term Market Indicators: The positive divergences abound, but keep in mind that sideways price movement has permitted these indicators to work their way back to the neutral zone. Instead of a rally from oversold lows to new, all-time highs, we got furious sideways chop.

CONCLUSION: It has really been an interesting two months (interesting as in the Chinese proverb). The market has declined about -11% from the September top, but most of the time, about two months, has been spent in a trading range. Trading ranges can be boring, but the problem with this one is that it is very wide -- about 7% between the top and bottom, which is a lot of real estate to traverse in the sharp price swings we have experienced. This week was probably the worst.
Once again we are at the bottom of the trading range and wondering if the bottom will hold. Being in a bear market, I have to assume that sooner or later we're headed lower. The ultra-short-term indicators allow for a little bounce next week. The intermediate-term indicators have cleared their oversold conditions of over a month ago, so they could accommodate more selling. Since I believe we're in a bear market, I expect the market is headed lower, although the path it takes will probably prove to be "interesting."
Read More »»»
• DiscoverGold
Information posted to this board is not meant to suggest any specific action, but to point out the technical signs that can help our readers make their own specific decisions. Your Due Dilegence is a must!
• DiscoverGold
Join the InvestorsHub Community
Register for free to join our community of investors and share your ideas. You will also get access to streaming quotes, interactive charts, trades, portfolio, live options flow and more tools.

