


| Followers | 0 |
| Posts | 148553 |
| Boards Moderated | 7 |
| Alias Born | 03/10/2004 |
Wednesday, November 07, 2018 11:51:58 AM
The Ord Oracle
By: Tim Ord | November 7, 2018
» SPX Monitoring purposes; Long SPX on 10/22/18 at 2755.88.
» Monitoring purposes Gold: Long VanEck Vectors Gold Miners (NYSE:GDX), at 18.72 on 8/17/18
» Long Term Trend SPX monitor purposes; Long SPX on 10-19-18 at 2767.78
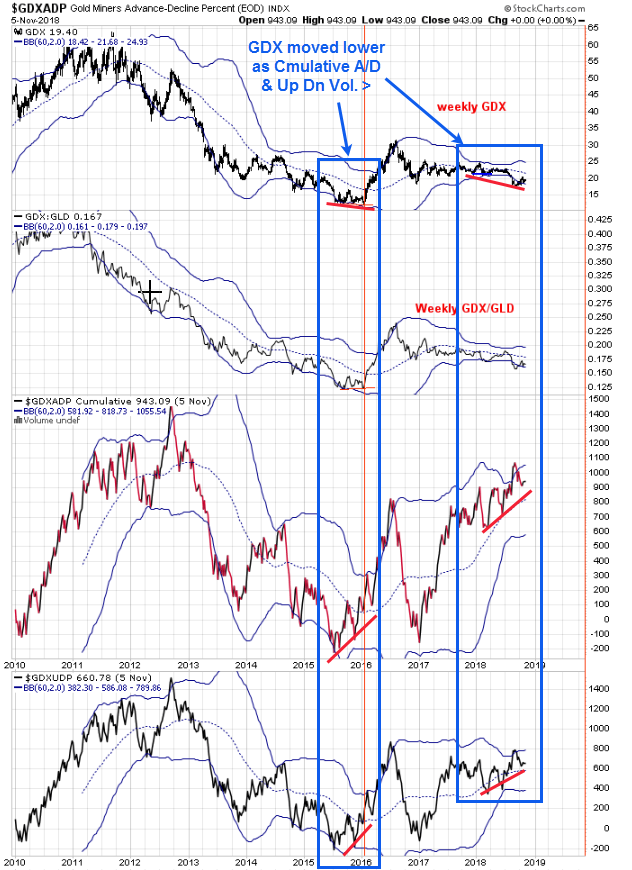
Above is a longer term view for GDX. The bottom window is the weekly Cumulative Up Down Volume indicator and above that is the weekly Cumulative advance/Decline indicator. If you look at the blue box in the middle of the chart dating around mid 2015 to early 2016, GDX was in a small trading pattern generally working lower. Notice that both Cumulative up down volume and Cumulative Advance/decline were making higher highs and higher lows produce a positive divergence. What came next was a huge rally in GDX that over doubled in six month. Starting in early 2018 GDX has been making lower highs and lower lows, but both Cumulative Up Down volume and Cumulative Advance/Decline have been making higher highs and higher lows similar to what happen in mid 2015 to early 2016. We only have data going back to 2010 which is a short fall of this study. Sentiment did have a washout in August suggesting a two year rally phase. We will hold our long position for now. Long GDX at 18.72 on 8/17/18. ord-oracle.com. New Book release "The Secret Science of Price and Volume" by Timothy Ord.
Read More »»»
• DiscoverGold
Click on "In reply to", for Authors past commentaries
Information posted to this board is not meant to suggest any specific action, but to point out the technical signs that can help our readers make their own specific decisions. Your Due Dilegence is a must!
• DiscoverGold
Recent GDX News
- Precious metals shares climb as U.S. tariffs extend to certain gold bars • IH Market News • 08/08/2025 01:45:14 PM


