


| Followers | 689 |
| Posts | 143817 |
| Boards Moderated | 35 |
| Alias Born | 03/10/2004 |
Monday, October 29, 2018 11:42:57 AM
NASDAQ Volatility Measure Suggests Market Bottom
By: Tom Bowley | October 29, 2018
All of our major indices finished lower on Friday and all of our major sectors did the same. It's difficult to paint a bullish picture after such selling, but I'm going to do just that. On Friday, despite selling at the open, our major indices rallied to close above its open for the third time in the past four trading sessions. It's beginning to feel like accumulation and that accumulation is taking place just as our sentiment indicators - Volatility Index ($VIX and $VXN) hit levels that typically mark significant stock market bottoms. On the surface, the action appeared bearish on Friday, but I'm turning a bit more bullish near-term.
Amazon.com (AMZN), Alphabet (GOOGL) and Intel (INTC) reported quarterly results on Thursday after the closing bell and those 3 stocks were in focus on Friday. AMZN and GOOGL both disappointed, especially in terms of revenues and guidance, and they both suffered significant losses. INTC, on the other hand, beat both top and bottom line estimates.....and raised guidance. That was important when we consider how poorly semiconductor stocks ($DJUSSC) have performed of late:
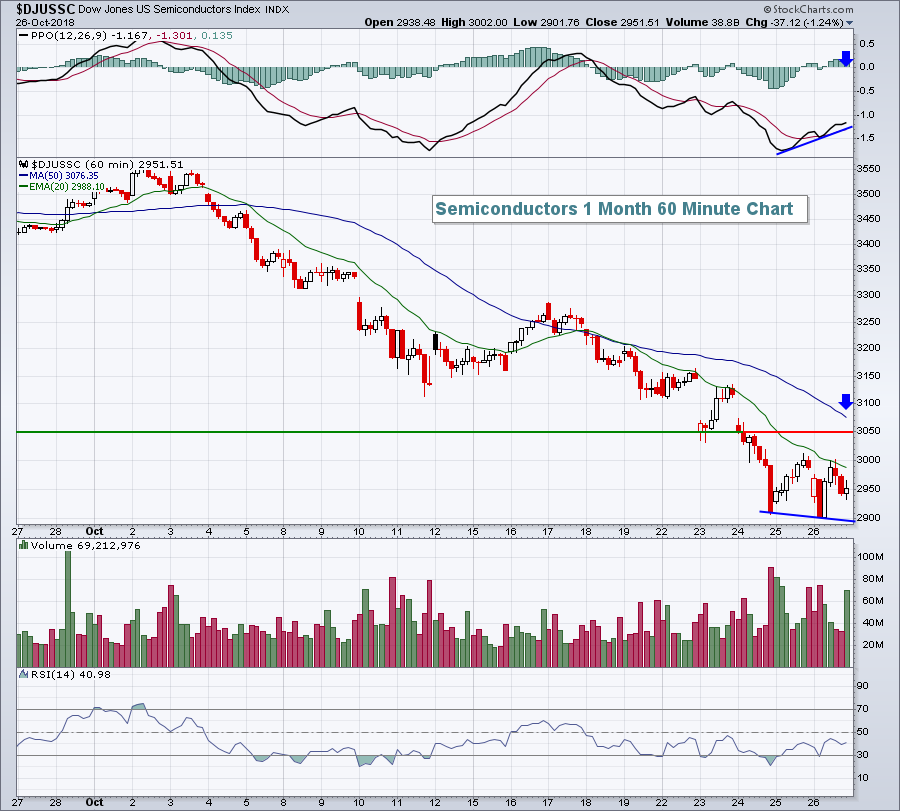
The DJUSSC isn't far from being down 20% for the month of October - that's crazy. It may turn out to be justified, but in the very near-term, it seems to be overdone. At Friday morning's early low, a positive divergence emerged (lower price with rising PPO). That suggests slowing price momentum. I'd look for strength in the DJUSSC of perhaps 3-4% early this week to lead a short-term rally in technology. After that, we'll see how the group reacts to overhead resistance. The 50 hour SMA has been very important resistance in October, so one signal that the market could be improving would be a definitive break back above that 50 hour SMA.
The two best performing sectors on Friday - materials (XLB, -0.59%) and energy (XLE, -0.75%) - appeared to benefit from a reversal in the Dollar Index Bullish Fund (UUP, -0.27%).
Pre-Market Action
Int'l Business Machines (IBM) has agreed to acquire Red Hat (RHT) for $34 billion in an all cash deal at $190 per share. RHT closed on Friday at just under $117 per share. This is the largest deal in IBM history and the third largest technology deal ever. This huge premium should provide a lift to the beaten-down tech sector, especially software stocks ($DJUSSW).
We saw mixed action overnight in Asia, but European markets are significantly higher. The German DAX ($DAX) is higher by 233 points, or 2.08%, at last check. Dow Jones futures are higher by 164 points as Wall Street attempts to recover from last week's barrage of selling.
Current Outlook
Generally, I like to look at the Volatility Index ($VIX), which measures expected volatility on the S&P. But since topping on October 1st, the NASDAQ 100 ($NDX) had fallen nearly 1000 points at Friday's intraday low, much more than the 10% correction level. Fear soared last week on the NDX and your guide to the NASDAQ's volatility is the Volatility Index - CBOE NASDAQ 100 ($VXN). Looking back at history, it's pretty clear to me that VXN readings in the 30s are a big deal and typically coincide with very significant bottoms:
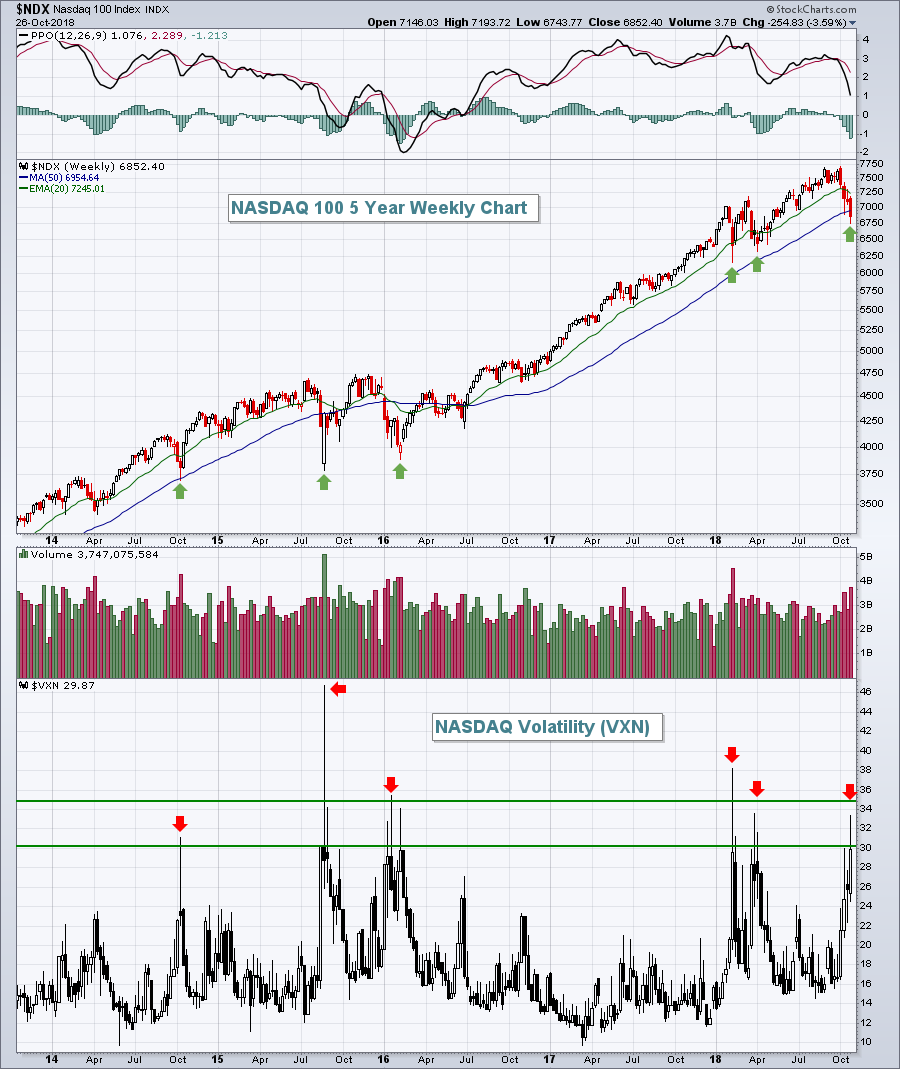
It's certainly possible for the stock market to resume its decline this week and the VXN to hit the 40s, maybe the 50s, possibly even higher. But the "norm" seems to be around that 30-35 level and we hit that last week. In my opinion, the risk of being out of the market at this point outweighs the risk of being in it with further price declines.
Sector/Industry Watch
Medical supplies ($DJUSMS) lost more than 10% last week and has been absolutely horrific during October. It's gone from trading at an all-time high to open the month to an 18 month low last week. While I won't ignore the technical damage from the October selling, the group is certainly primed for at least a short-term bounce as its weekly RSI nearly touched 30 at Friday's close, something it hasn't done in the past 7 years:
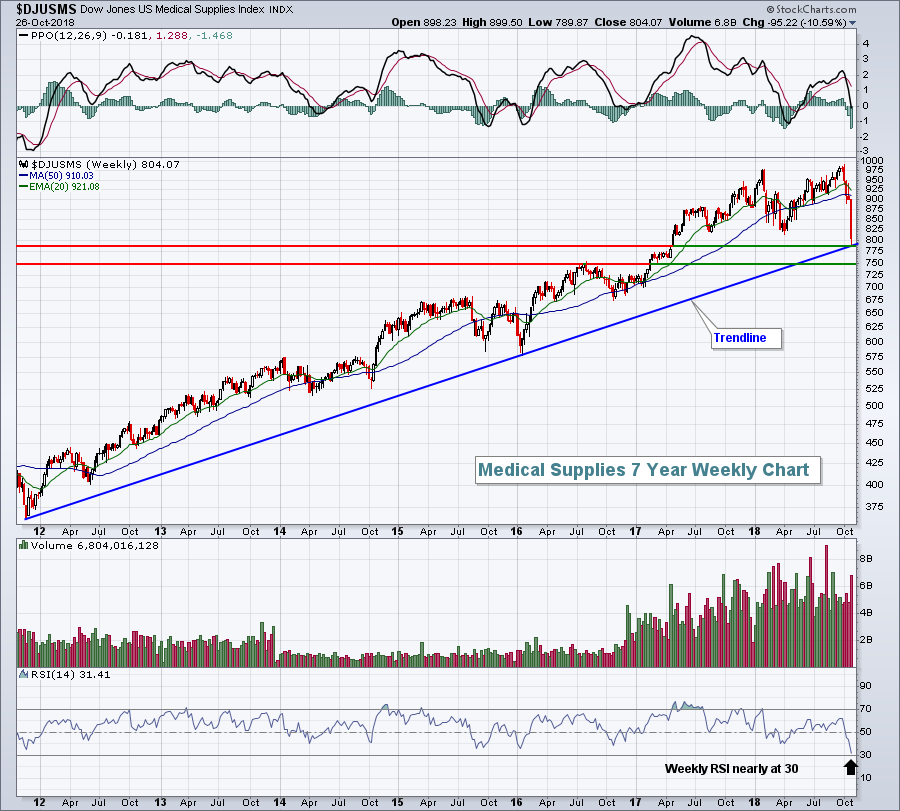
An argument could be made that last week's low tested its 7 year trendline. In addition, I view the 750-780 area as key price support where I'd look for a reversal and bounce.
Read More »»»
• DiscoverGold
Information posted to this board is not meant to suggest any specific action, but to point out the technical signs that can help our readers make their own specific decisions. Your Due Dilegence is a must!
• DiscoverGold
Join the InvestorsHub Community
Register for free to join our community of investors and share your ideas. You will also get access to streaming quotes, interactive charts, trades, portfolio, live options flow and more tools.

