


Sunday, October 21, 2018 6:17:17 AM
TA/Chart Update: We have a Double Doji pattern going on currently on the daily chart and a doji on the weekly chart...
This is a VERY VERY VERY bullish set up especially having volume behind it...
Look it up...
It's time...
Breakout price line is $0.0071 which also happens to be the 50 day Moving Average resistance as well...
If this breaks above that, then it should shoot northbound and fast...
The doji set up is a reversal signal when it forms at the top or bottom of a trend (for us it is at the bottom of a downtrend)...
With a Double Doji, during a downtrend, the high of the highest doji, usually being the 2nd doji is the bullish breakout point - ESPECIALLY when it lines up with a resistance area (in our case roughly at the 50 day Moving Average)... Same is true with the low of the lowest doji, usually the 2nd doji at the top of an uptrend as far as a bearish breakout...
That reinforced by a doji on the weekly chart is a big signature, especially with volume....
Also we've had a couple of other bullish candlestick patterns recently to include the latest and strongest bullish pattern called the bullish harami cross, the bullish meeting line, and a bullish piercing line recently...
The chart here keeps forming higher lows... And the chart doesn't seem like it wants to give up the previous dips low at $0.0050 where after a week straight of trading the lowest low that was constantly tested and held is at $0.0054...
The 50 day Moving Average has turned from a strong downtrend to a sideways trend, and is slowly starting to uptick - and it should begin to pick up the pace of the up ticking soon... The 50 day Moving Average is considered the daily chart's trend defining identifier... If the 50 day Moving Average is moving down, the chart is said to be in a bearish trend, if it moves up, the chart is in an uptrend, and if it moves sideways it is trading in a range IE consolidating... So turning from a downtrend to sideways slightly uptrending is a reversal in trend and a signal of the bottom here especially when met with volume, especially met with volume that showed up no where else on the chart... Now we need the price to get above the 50 day Moving Average and then to get the 50 day Moving Average above the 200 day Moving Average to deem the bulls as in charge...
The 50 day Moving Average is about to begin up ticking, while the 100 day Moving Average isn't very far above and is down ticking, though starting to level out itself just like the 50 day Moving Average recently did... This is a bullish sign as this shows the lines are about to turn upwards, the 50 day Moving Average will turn the fastest, and if it crosses above the 100 day Moving Average, you have a Golden Cross, which is a bullish signal... All the same is true with these moving averages and the 200 day Moving Average above, but not very far above and also leveling out slowly... Which is currently where the target price will be....
Between the 200 day Moving Average and the recent bullish trend reversal pattern target price, the price here should reach anywhere from the 200 day Moving Average to $0.05... Infact if you look at the weekly chart, the 50 week Moving Average is at $0.0504...
The 50 day Moving Average CURRENTLY at $0.0071 and upticking.
The 100 day Moving Average is CURRENTLY at $0.0095 and downticking.
The 200 day Moving Average is CURRENTLY at $0.0381 and downticking.
Current support line is $0.0050.
Currently all are acting as resistance, but with the upticking ones like the 50 day Moving Average should act as a stronger support than resistance, so it shouldn't be too hard to get above it, and we should find it easier to hold above it when we do get above it... Those moving averages that are downticking like the 100 and 200 day Moving Averages will act as a stronger resistance than support, the 100 day Moving Average has already been public enemy #1 and our chart's strongest resistance point - which means it is the focal resistance point to break above and close above... This will give us a clearance to test the 200 day Moving Average resistance... And if we can get above the 100 day Moving Average, it won't be long until it starts upticking and acts as a stronger support point... AS you can see, the chart is progressively setting itself up to make all this happen...
Here by the way are what I think the most key trendlines:
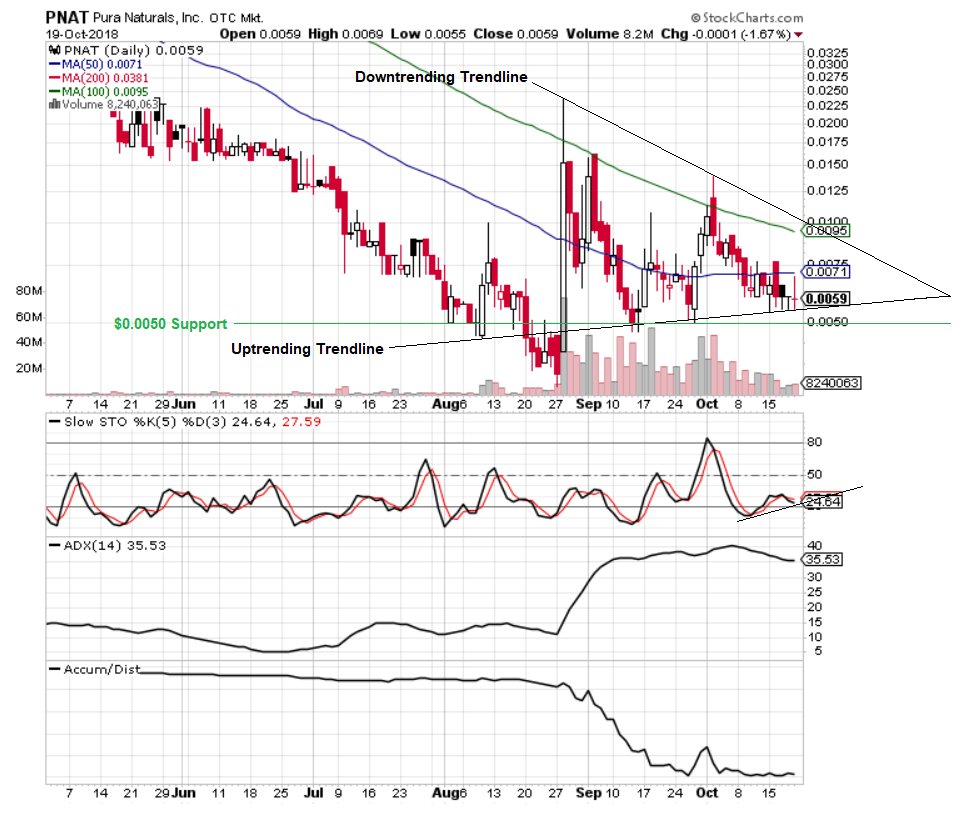
https://pbs.twimg.com/media/Dp7e75IW4AA6d7q.jpg
Momentum indicators are reset and signaling bullish momentum is soon to come looking at the RSI, stochastics, and MACD... PSAR is bearish, but not of concern right now... The accumulation chart is beginning to uptick, the ADX as well....
The chart is really showing a bottoming here... And I strongly believe it will explode to the north soon...
I like how CFGN - the biggest dilution market maker has disappeared from the Level 2, and when it last was on the chart it was actually on the BID at $0.0500 support and at $0.015 if I remember right on the ASK... The only concerning Market Maker on the level 2 right now is MAXM at $0.01... Not too concerning either... The signs show that dilution has backed off...
I direct you to this post of mine where I also gave some other good information like fundamentals, and share structure info...
https://investorshub.advfn.com/boards/read_msg.aspx?message_id=144321489

Guess who's back. Tell a friend!
Join the InvestorsHub Community
Register for free to join our community of investors and share your ideas. You will also get access to streaming quotes, interactive charts, trades, portfolio, live options flow and more tools.

