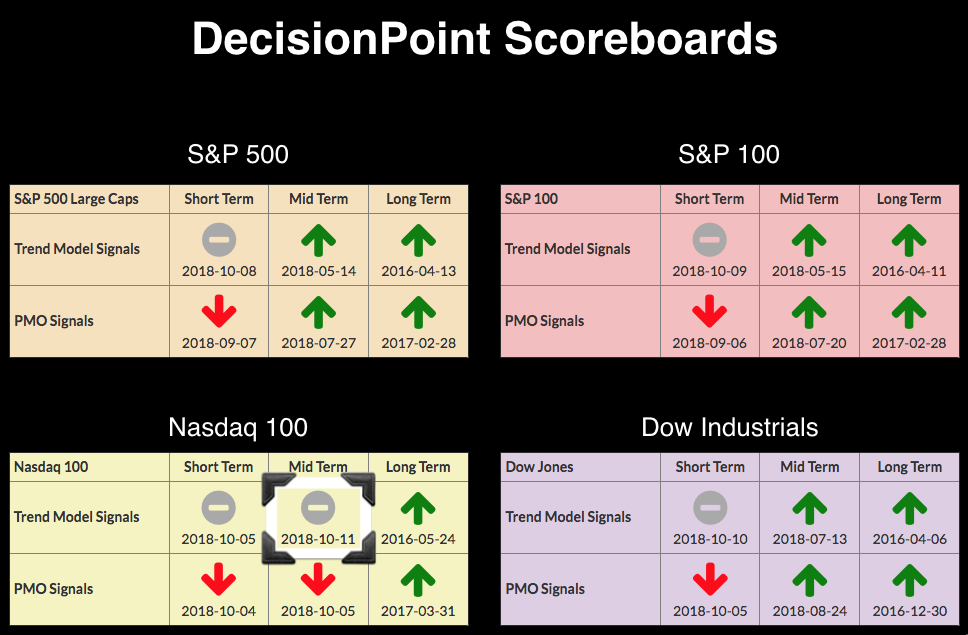
NDX IT Trend Model Neutral Signal - Climactic Breadth Readings Continue By: Erin Swenlin | October 11, 2018
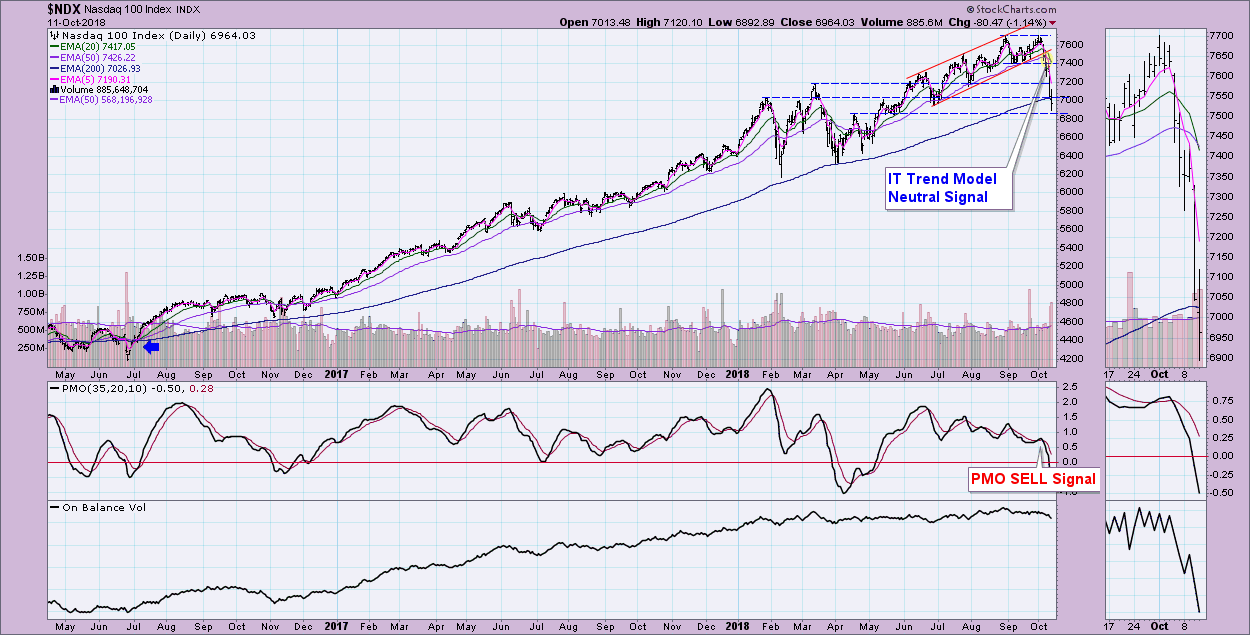
The Intermediate-Term Trend Model Neutral signal generated today on the Nasdaq 100 (NDX) replaced a May 9, 2018 BUY signal. It was another exhausting day as we watched the correction continue with prices free falling lower. Yesterday I pointed out the climactic breadth and VIX readings and suggesting a selling exhaustion was underway. I went out on a limb (which I hear cracking right now) and wrote that I'm looking for a bounce before the week ends. Breadth readings are still suggesting a selling exhaustion to me. Be aware, these are very short-term indicators so seeing a rally pop is not the same as an intermediate-term bottom.
The IT Trend Model Neutral signal was triggered when the 20-EMA crossed below the 50-EMA while the 50-EMA was above the 200-EMA. Had the 50-EMA been below the 200-EMA at the time of the crossover, it would have been a SELL signal. Price absolutely busted through the 200-EMA as well as support along the January top. Notice we haven't seen price below the 200-EMA since July 2016! Considering how far above the 200-EMA price was at the beginning of the week, it's hard to believe that price fell so far so fast. Price is extremely oversold now and should see a bounce, at least in the short term.
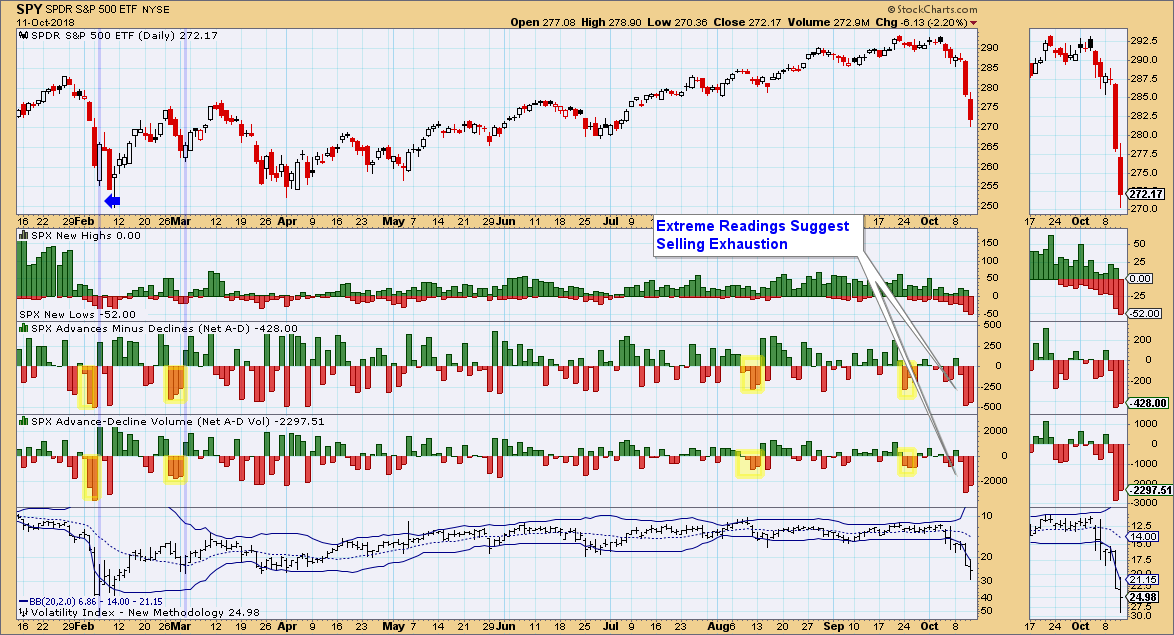
Possible supporting evidence that a short-term bounce is overdue would be the DP Climactic Indicator chart. The VIX has closed once again below its lower Bollinger Band. Additionally we saw very high breadth readings. I've annotated the similar setup that we had in early February and early March. These spikes suggest a very short-term selling exhaustion and the likelihood of a bounce nearing. Whether it will be enough to kickstart the rally again, I have my doubts given the appearance of that IT Trend Model Neutral on the NDX.
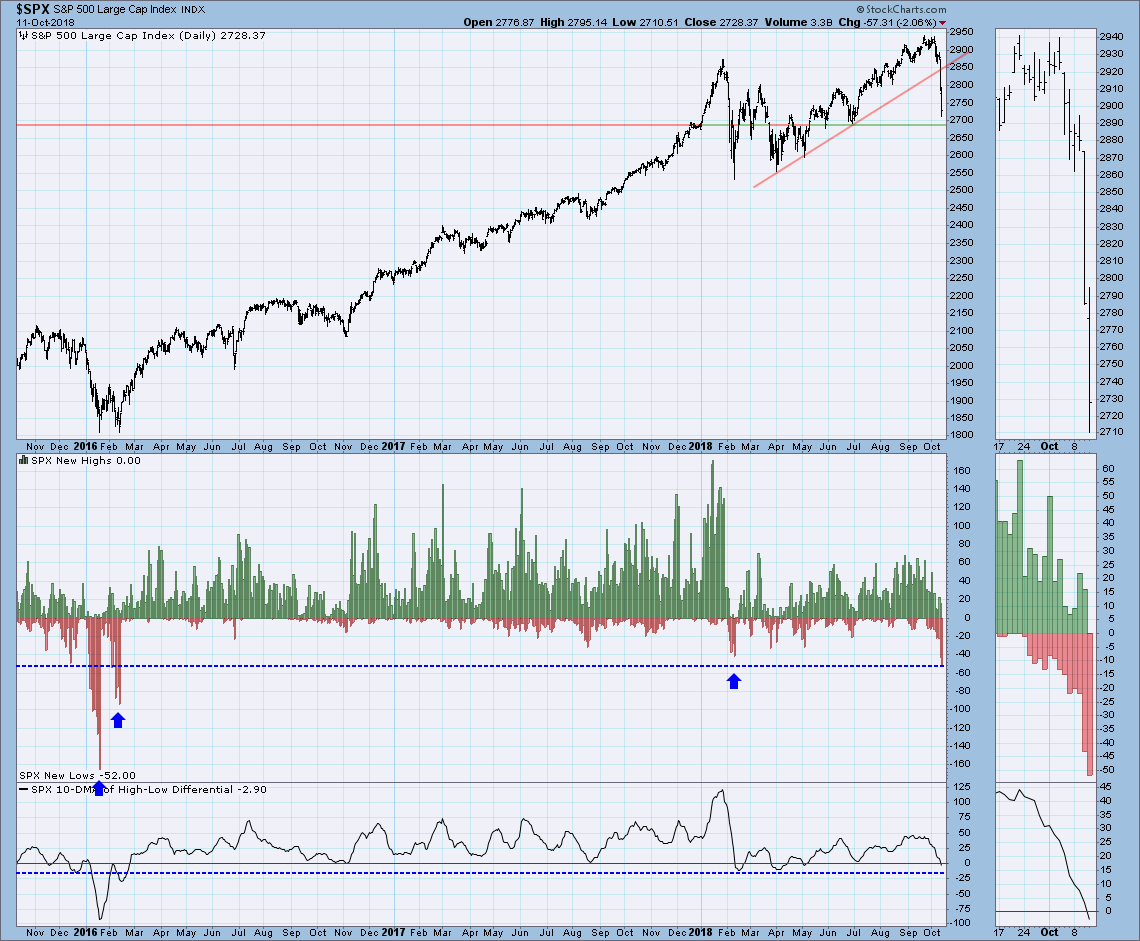
Another climactic chart would be the New Highs/New Lows. I'm not seeing the 10-DMA of the High-Low Differential turning up yet. However, the negative readings have not been seen since the beginning of 2016. In both cases it did result in a short-term rally.
Conclusion: Adding the IT Trend Model Neutral signal to the NDX Scoreboard is very troubling for the intermediate term. Tom Bowley made a great point this morning on MarketWatchers LIVE that when the VIX readings begin to reach above 20, the market is vulnerable to very quick and very large swings to the downside. However, extreme readings like these typically mark a short-term bottom. I'm reminded of the 'catching a falling knife' cliche we use as I wait for that bounce. Let's see if we get a 'rally pop' tomorrow based on the climactic VIX and breadth readings. If not, I hope I don't injure myself too terribly when the limb I went out on yesterday breaks!
Technical Analysis is a windsock, not a crystal ball.
Information posted to this board is not meant to suggest any specific action, but to point out the technical signs that can help our readers make their own specific decisions. Your Due Dilegence is a must! • DiscoverGold
Register for free to join our community of investors and share your ideas. You will also get access to streaming quotes, interactive charts, trades, portfolio, live options flow and more tools.


 News
News  Market Data
  Discover