


| Followers | 0 |
| Posts | 148553 |
| Boards Moderated | 7 |
| Alias Born | 03/10/2004 |
Wednesday, September 12, 2018 11:50:05 PM
The Ord Oracle
By: Tim Ord | September 12, 2018
SPX Monitoring purposes; Sold long SPX 9/7/18 at 2871.68=loss 1.03%: long 2901.52 on
8/31/18.
Monitoring purposes GOLD: Long GDX at 18.72 on 8/17/18
Long Term Trend SPX monitor purposes; Sold long term SPX 7/16/18 at 2798.43= gain 2.95%; Long 6/29/18 at 2718.37.
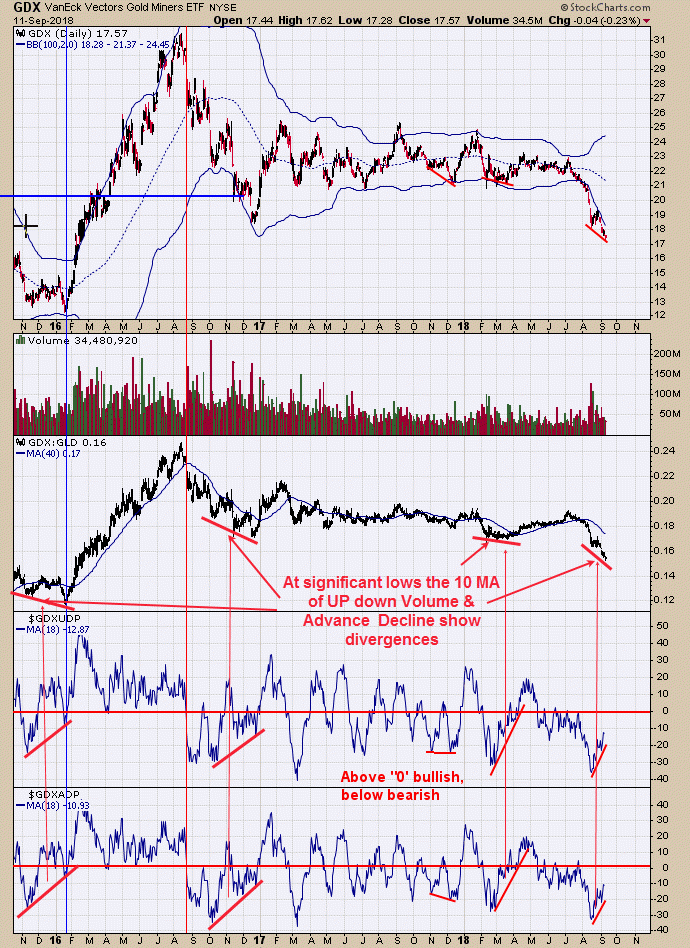
We updated this chart from yesterday. The bottom window is the 18 MA of the Advance/Decline and above that the 18 MA of the Up Down Volume and both indicators broke to new recent highs and made higher lows as GDX was making lower lows. We went back to all major lows in GDX going back to the January 2016 low and found that they all showed major bullish divergences like we are having now. I might point out that a more ideal signal for a long position is when the Advance/Decline and Up Down volume indicators both close above “0” and that has not happened here, at least not yet. The COT commercial report for Gold, published last Friday, showed that Gold Commercials are not now net long 6525 contracts; the last time the commercials were net long came back at the 2001 gold bottom. Long GDX at 18.72 on 8/17/18.
Tim Ord,
Editor
https://stockcharts.com/articles/tac/2018/09/tim-ord-the-ord-oracle-september-12-2018.html
• DiscoverGold
Click on "In reply to", for Authors past commentaries
Information posted to this board is not meant to suggest any specific action, but to point out the technical signs that can help our readers make their own specific decisions. Your Due Dilegence is a must!
• DiscoverGold
Recent GDX News
- Precious metals shares climb as U.S. tariffs extend to certain gold bars • IH Market News • 08/08/2025 01:45:14 PM


