DP (SPY) Weekly/Monthly Wrap: Is Another Parabolic Advance Beginning? By: Carl Swenlin | August 31, 2018
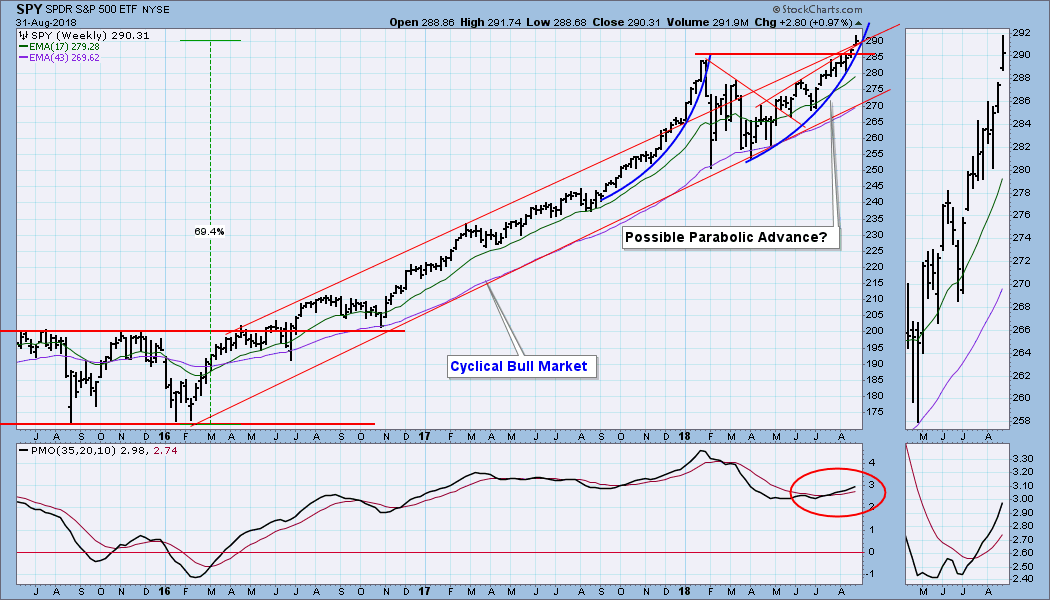
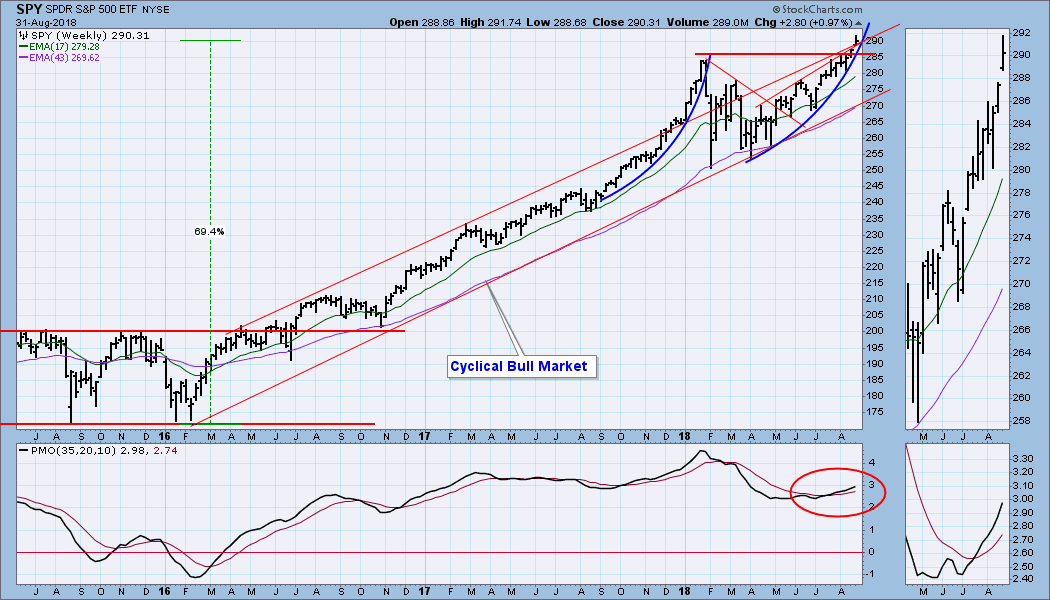
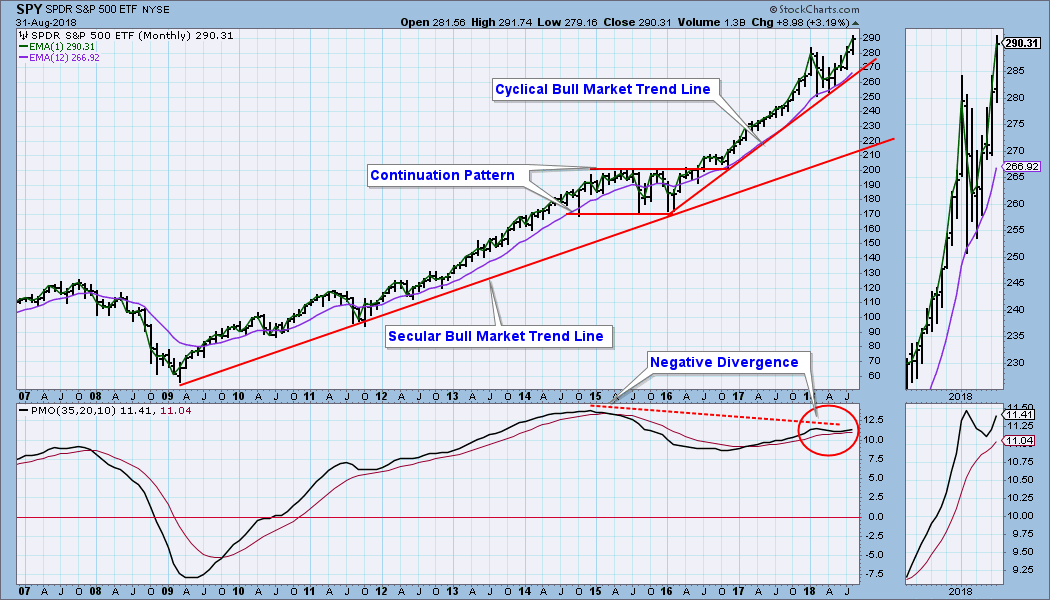
This week, as the market once again broke out of the cyclical bull market rising trend channel, it occurred to me that perhaps another parabolic advance was getting under way. On Wednesday I was a guest of Erin and Tom on MarketWatchers LIVE, and I gave a more detailed account of how my thinking developed on this matter. We don't have to search the data too deeply to give an example of what I mean -- the last parabolic began in late-2017 and ended early this year. Conveniently, we can compare the current upward curve with the last one, and we can see that the new curve is not very steep yet, but, as I said, the real action may be just beginning. More on this to follow.
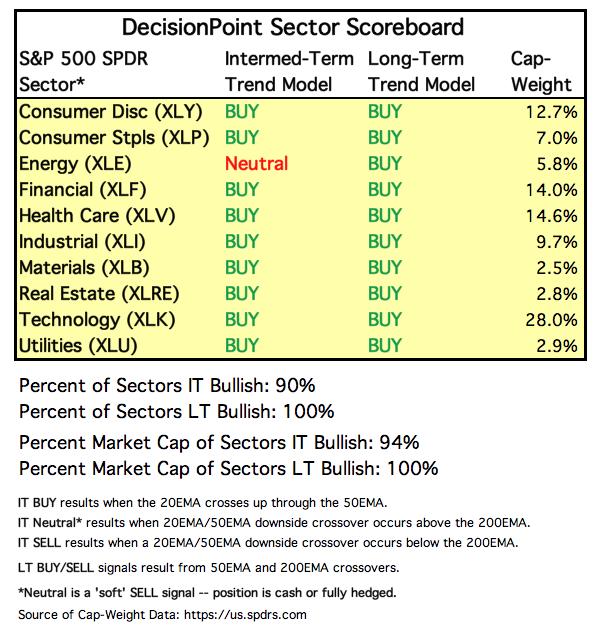
SECTORS
Each S&P 500 Index component stock is assigned to one, and only one, of 10 major sectors. This is a snapshot of the Intermediate-Term and Long-Term Trend Model signal status for those sectors.
STOCKS
IT Trend Model: BUY as of 5/11/2018
LT Trend Model: BUY as of 4/1/2016
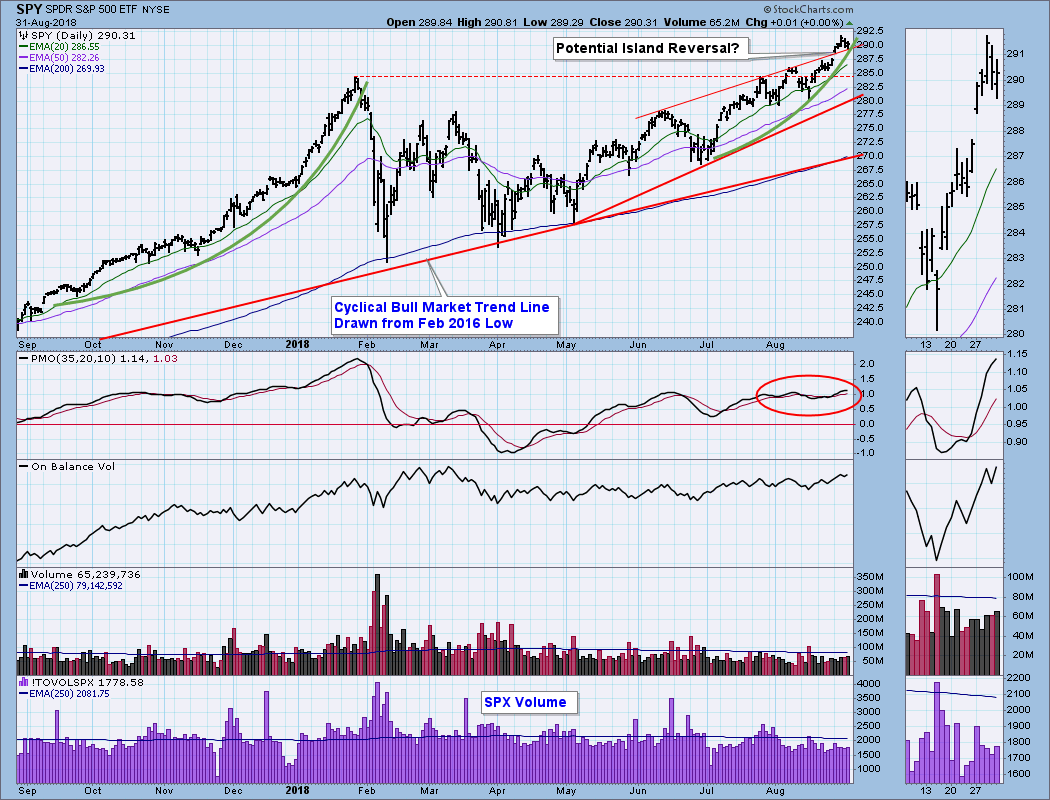
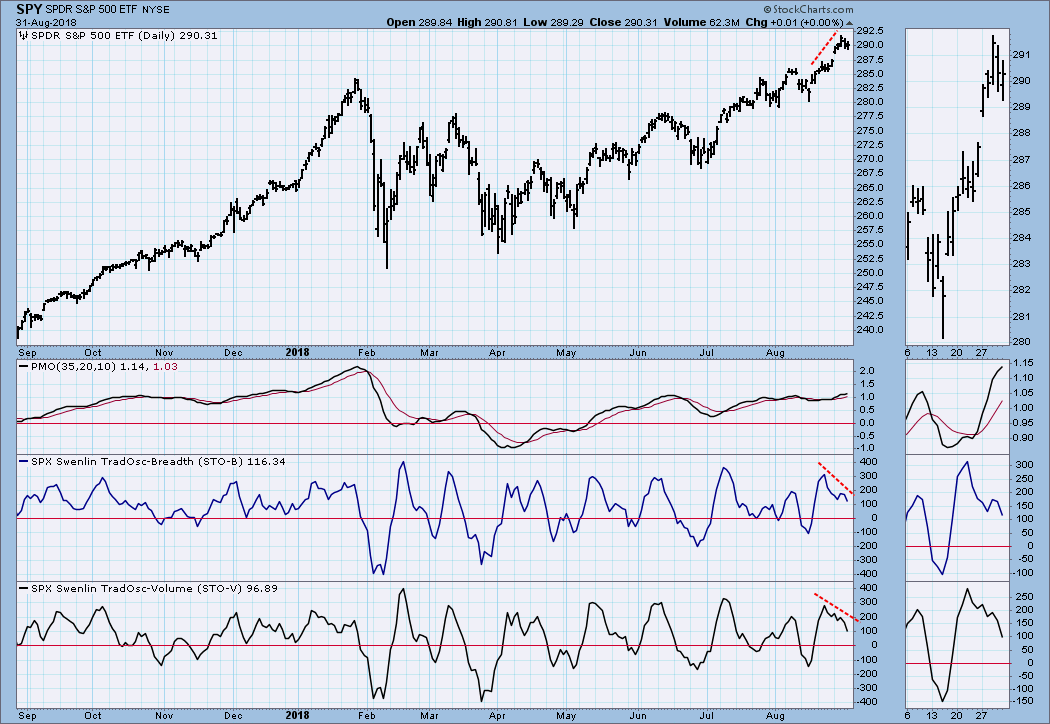
SPY Daily Chart: On the daily chart we get a better view of the details of the current advance compared to the one that ended in January. As I said, it may be just beginning, but it needs to get a lot steeper. There is another angle here, though. The gap up on Monday that got us thinking along these lines creates a problem because the rest of this week's price action created an island that just begs for a reversal. Whatever the answer to this conflict, I think we will surely have it next week.
SPY Weekly Chart: I am repeating this article's lead chart here for the sake of continuity. Note that the weekly PMO is positive.
SPY Monthly Chart: The monthly PMO negative divergence shown does not really concern me, because price is making new highs and the PMO is rising.
Short-Term Market Indicators: There are some sharp negative divergences here. Again, we seem to be set up for a short-term pullback.
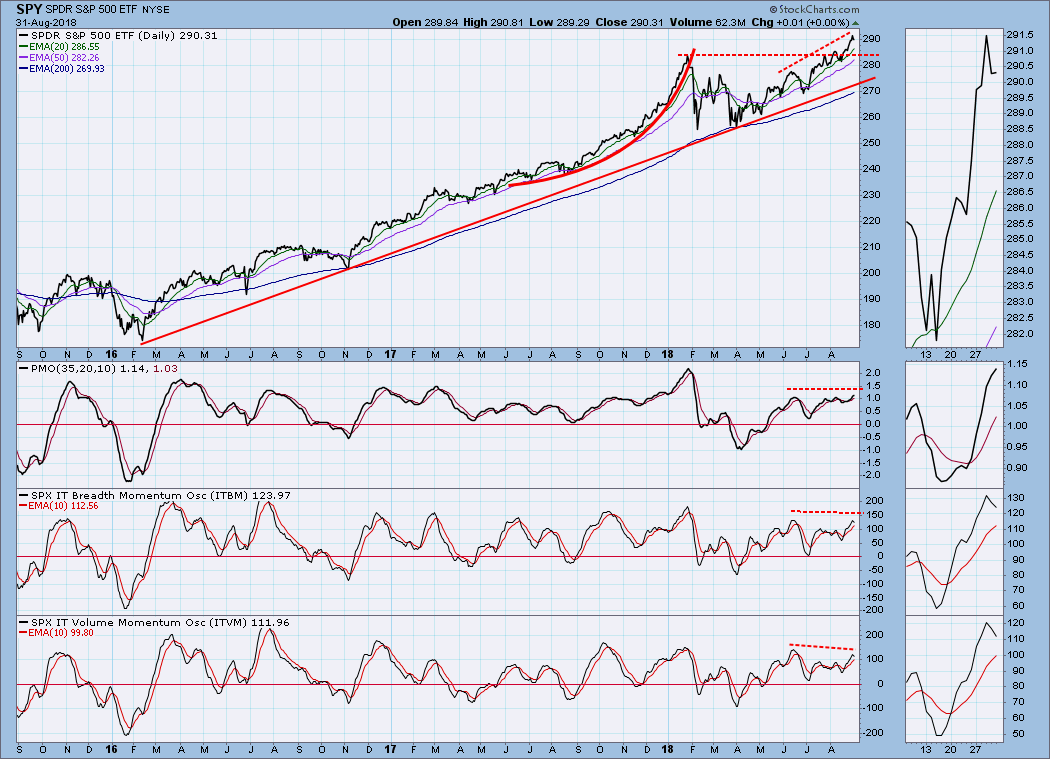
Intermediate-Term Market Indicators: Negative divergences persist in this time frame, although they are not as steep as they were last week.
Conclusion: Last week I thought we had a setup for a short-term correction, but that did not materialize. Instead on Monday price gapped up out of the rising trend channel, and this got me thinking in terms of a parabolic melt up. Of course, the gap and subsequent island also smacks of a reversal. Neither outcome would surprise me, and a reversal won't necessarily destroy the parabolic potential, because the market seems relentlessly positive and irrepressible. Let's hope next week's action clears things up.
Click on "In reply to", for Authors past commentaries
Information posted to this board is not meant to suggest any specific action, but to point out the technical signs that can help our readers make their own specific decisions. Your Due Dilegence is a must! • DiscoverGold
Register for free to join our community of investors and share your ideas. You will also get access to streaming quotes, interactive charts, trades, portfolio, live options flow and more tools.


 News
News  Market Data
  Discover