DP (SPY) Weekly Wrap: SPY New All-Time Highs; Crude New BUY Signal; Has Gold Bottomed? By: Carl Swenlin | August 24, 2018
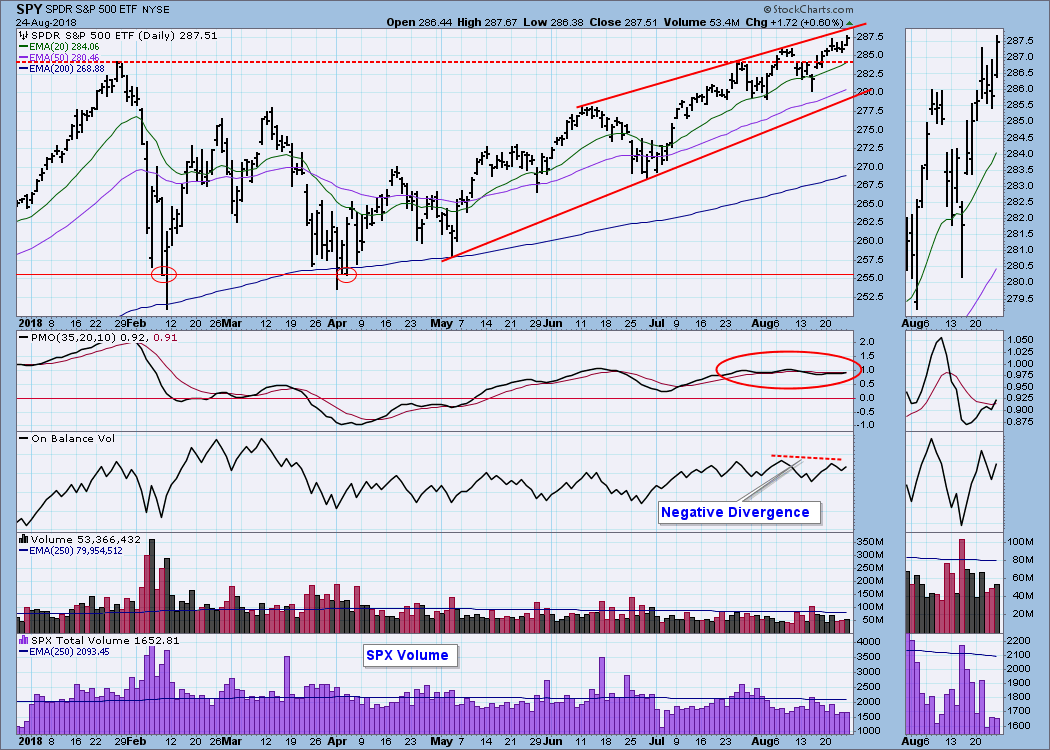
On Friday SPY made new, all-time intraday and closing highs, exceeding the records set on Tuesday. The daily PMO has been very flat and holding at around +1 since the end of July. This summarizes the steady price rise during that period and does not present a problem. There is, however, a problem on the OBV panel in the form of a negative divergence. It is not a giant issue, but we will consider it later in this article.
SECTORS
Each S&P 500 Index component stock is assigned to one, and only one, of 10 major sectors. This is a snapshot of the Intermediate-Term and Long-Term Trend Model signal status for those sectors.
STOCKS
IT Trend Model: BUY as of 5/11/2018
LT Trend Model: BUY as of 4/1/2016
SPY Daily Chart: The only overhead resistance at this point is the top of the rising wedge. The only horizontal resistance will be the current new highs. I have pointed out the OBV negative divergence corresponding with this month's two tops. I think it is reasonable to expect a little pullback in response to that. One might ask if the OBV's failure to exceed the OBV tops in February and March is also a negative divergence. Technically it is, but I personally do not give weight to such long distance divergences.
SPY Weekly Chart: I don't see any problems in this time frame. Price is moving up in the rising trend channel, and the weekly PMO shows a solid bottom.
Short-Term Market Indicators: As price is making higher highs, the STO-B and STO-V have topped. Short-term weakness is likely.
Intermediate-Term Market Indicators: The indicators in this time frame are still showing negative divergences; although, Friday's ITBM and ITVM readings exceed their tops earlier this month. This confirms the short-term price trend.
Conclusion: The STO-B, STO-V, and OBV are telling us to look for a short-term correction. The ITBM and ITVM are modestly overbought, so a correction could extend beyond the short-term, but I think that is a low probability.
Click on "In reply to", for Authors past commentaries
Information posted to this board is not meant to suggest any specific action, but to point out the technical signs that can help our readers make their own specific decisions. Your Due Dilegence is a must! • DiscoverGold
Register for free to join our community of investors and share your ideas. You will also get access to streaming quotes, interactive charts, trades, portfolio, live options flow and more tools.


 News
News  Market Data
  Discover