NDX Erases ST Neutral Signal By: Erin Swenlin | August 2, 2018
NDX Erases ST Neutral Signal - Insult to Injury...TLT Adds Another SELL Signal
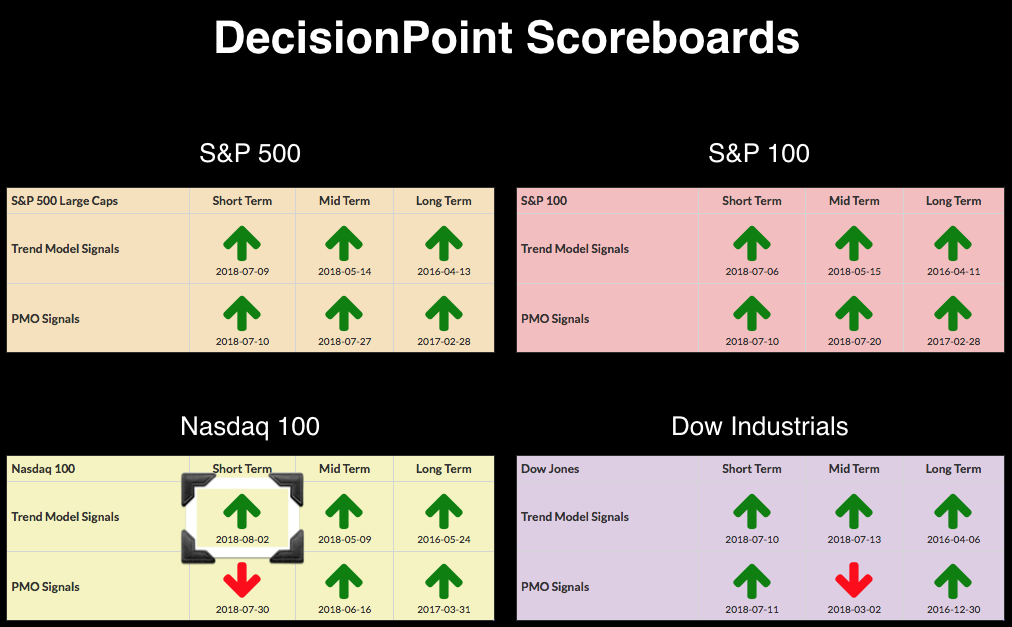
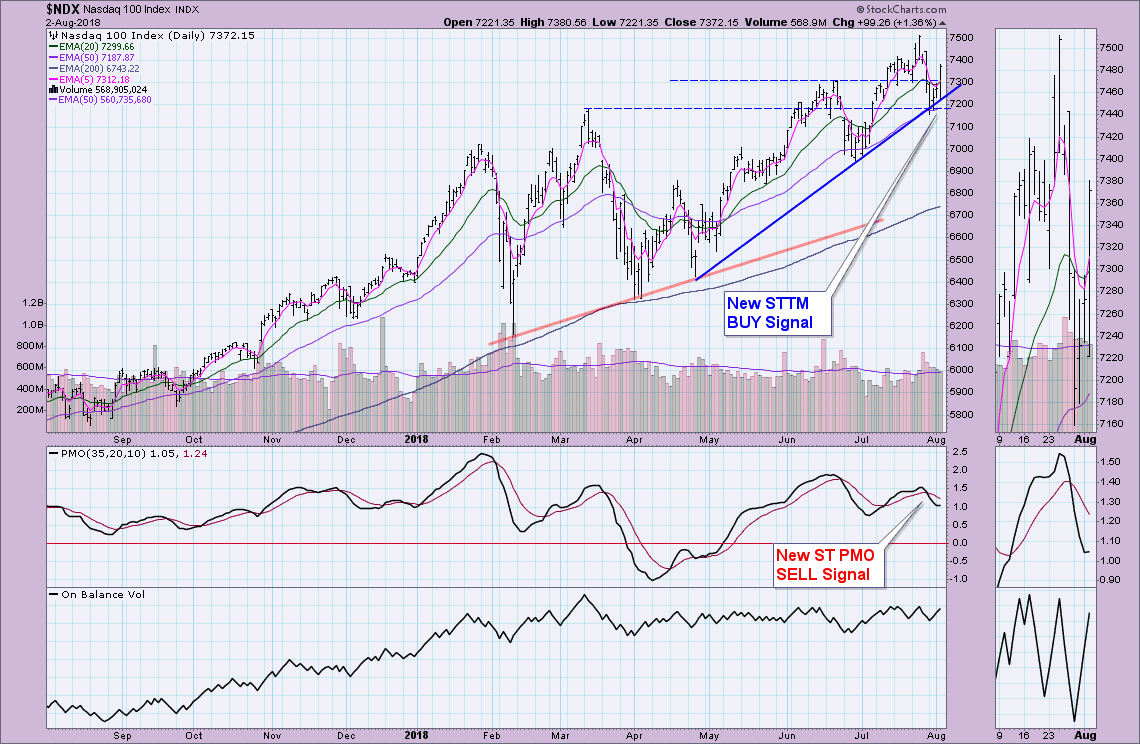
The ST Trend Model Neutral signal that the NDX carried for a few days gave way to a new BUY signal as the 5-EMA launched above the 20-EMA on today's strong rally. I've annotated the change on the DecisionPoint Scoreboards below. TLT triggered a Long-Term Trend Model SELL signal yesterday and today it is now being followed up with a Intermediate-Term Trend Model SELL signal.
I noted two days ago when the PMO and STTM generated bearish signals that the NDX was at a critical point of support where the June top and rising bottoms trendlines intersected. If the NDX couldn't hold that support area, the next likely area of support was down to 7000. If we see some follow-through on this rally, the PMO will shed the SELL signal.
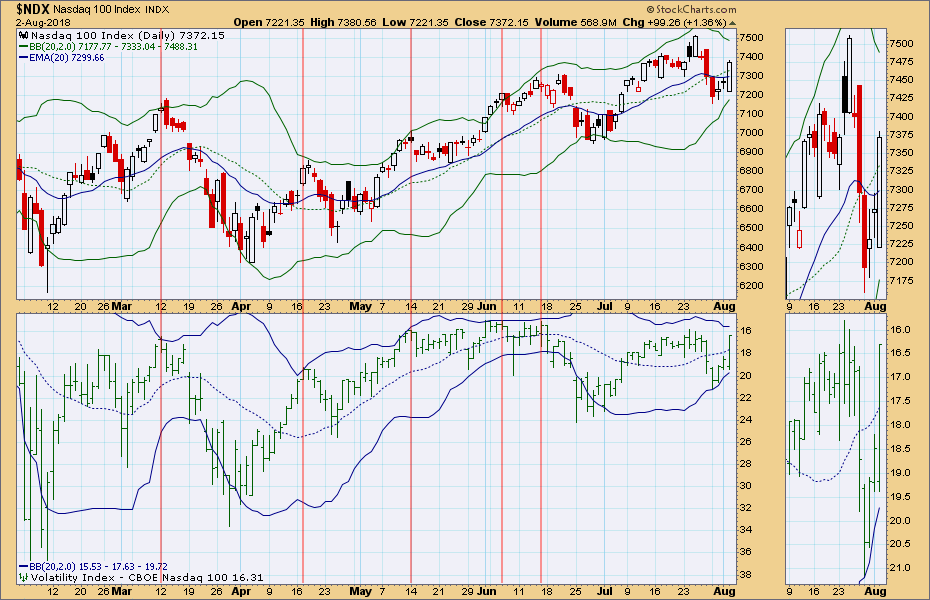
Interestingly, the $VXN popped skyward but hasn't quite punctured the upper Bollinger Band on the inverted scale. I invert the scale because I use it as a very very short-term indicator to project the next few days. When the market gets very complacent and bullish with a low VIX or in this case, VXN reading and you see a reading above the upper band, typically it will be followed by some downside price activity over the next few days. We didn't see it punch through the band despite a huge decrease in the reading, so I would look for some more follow-through to upside. Just keep watch for that upper band penetration.
A new Intermediate-Term Trend Model SELL signal was triggered when the 20-EMA crossed below the 50-EMA while they were below the 200-EMA. Had the crossover occurred above the 200-EMA, it would have been a neutral signal. The rapid decline has been fueled by higher yields, but we did get warning with the overbought PMO SELL signal last month. The recent LT and IT Trend Model SELL signals are confirmation that a continuation of the correction on Bonds should be expected.
Technical Analysis is a windsock, not a crystal ball.
Information posted to this board is not meant to suggest any specific action, but to point out the technical signs that can help our readers make their own specific decisions. Your Due Dilegence is a must! • DiscoverGold
Register for free to join our community of investors and share your ideas. You will also get access to streaming quotes, interactive charts, trades, portfolio, live options flow and more tools.


 News
News  Market Data
  Discover