Momentum is on the Rise for Large-Cap Index Components By: Erin Swenlin | July 5, 2018
Although we haven't quite seen any changes on the DP Scoreboards in the "momentum" category, detailed analysis of the PMO in all three timeframes shows signs that components of these indexes are gaining positive momentum.
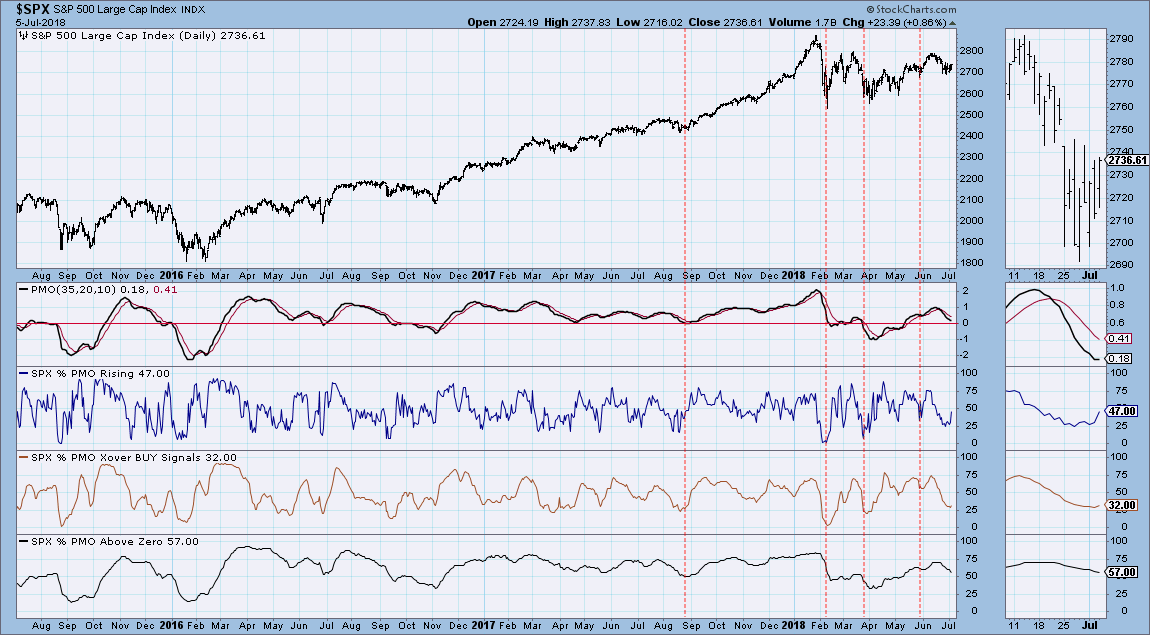
The PMO Analysis charts below are in the DecisionPoint Market Indicator ChartPack. It's free to download for Extra members and above. On these charts, the pane below the PMO, is the short-term component. This tells us the percentage of SPX stocks that have the PMO rising. It hit oversold territory around 25% and is now turning back up, already to nearly 50%. The next pane, is the intermediate-term component. Currently we are seeing about 1/3 of all SPX stocks are on PMO BUY signals (PMO is above its signal line). The final pane is the long-term indicator that tells us how many of the stocks have PMOs above the zero line. All but the long-term are showing bottoms and clear moves upward. I've annotated what generally happens to price on these oversold bottoms. It generally leads to higher prices.
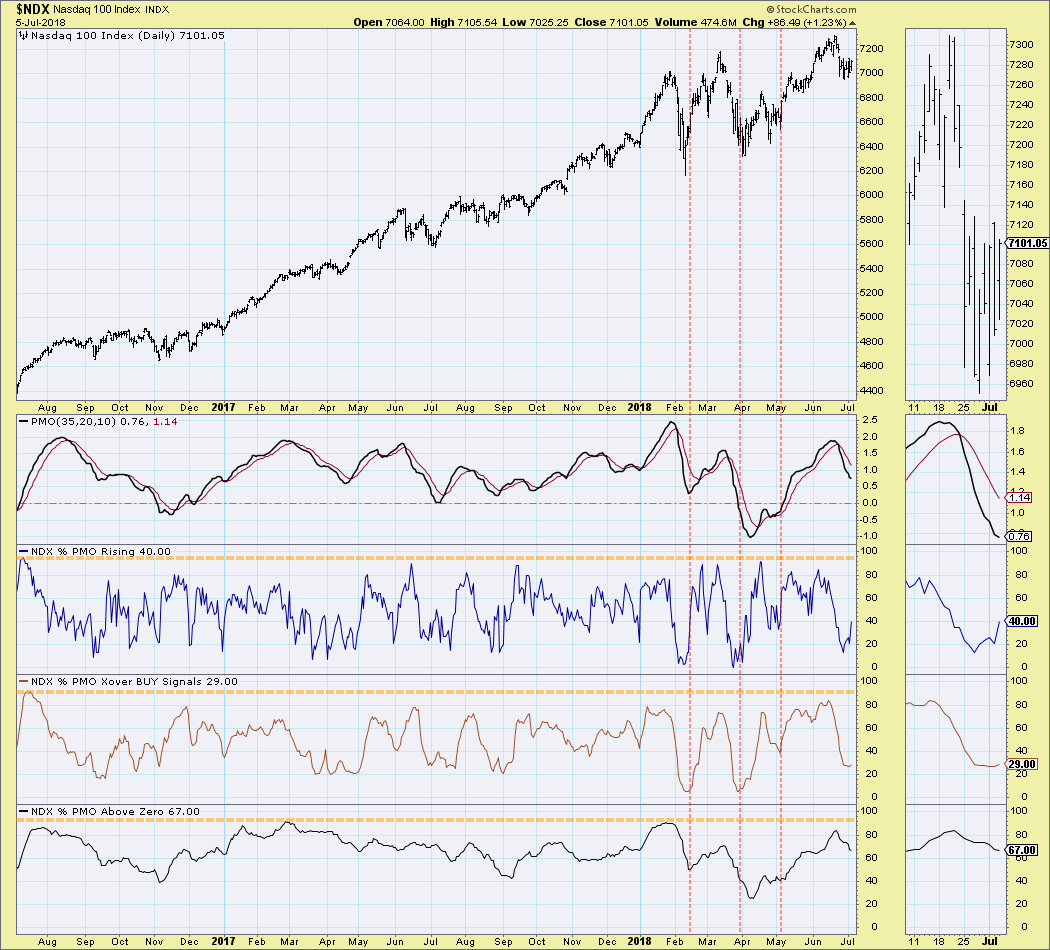
The NDX is also showing progress out of oversold readings. Although the % PMOs above the zero line is flat, we are still seeing 2/3 of the NDX components have PMOs above the zero line.
Same on the OEX but looking in the thumbnail it does appear the longer-term component is trying to bottom.
The Dow is also looking healthier as its component stocks are showing more PMOs rising and on BUY signals.
Conclusion: While the longer-term % PMOs Above Zero aren't quite rising yet, we are seeing deceleration. In all four indexes, we still show over half of their component have PMOs above the zero line. The distinct improvement on all four indexes in the short and intermediate terms did surprise me somewhat given the consolidation/indecision we've been seeing on those indexes. These charts suggest resolution of this consolidation zone should be to the upside.
Technical Analysis is a windsock, not a crystal ball.
Information posted to this board is not meant to suggest any specific action, but to point out the technical signs that can help our readers make their own specific decisions. Your Due Dilegence is a must! • DiscoverGold
Register for free to join our community of investors and share your ideas. You will also get access to streaming quotes, interactive charts, trades, portfolio, live options flow and more tools.


 News
News  Market Data
  Discover