


| Followers | 689 |
| Posts | 143817 |
| Boards Moderated | 35 |
| Alias Born | 03/10/2004 |
Monday, July 02, 2018 9:07:55 AM
Watch Potential Channel Support On The NASDAQ 100
By: Tom Bowley | July 2, 2018
The first half of 2018 ended on Friday in bifurcated fashion, which is fitting given that most of 2018 has seen bifurcated action thus far. The NASDAQ gained nearly 9% in the first six months, with the Russell 2000 not too far behind, gaining more than 7%. The S&P 500, however, saw only a 1.7% rise and the Dow Jones ended the first half of the year in negative territory as a rising dollar and trade fears sent traders scurrying out of those large multinational companies, especially those on the Dow Jones. Caterpillar (CAT), for instance, is down roughly 13% in the six months ended June 30.
The rising Dollar Index ($USD) was problematic for large caps, but a boon to smaller issues. As we begin Q3, however, it appears the USD could be in for short-term choppy waters ahead:
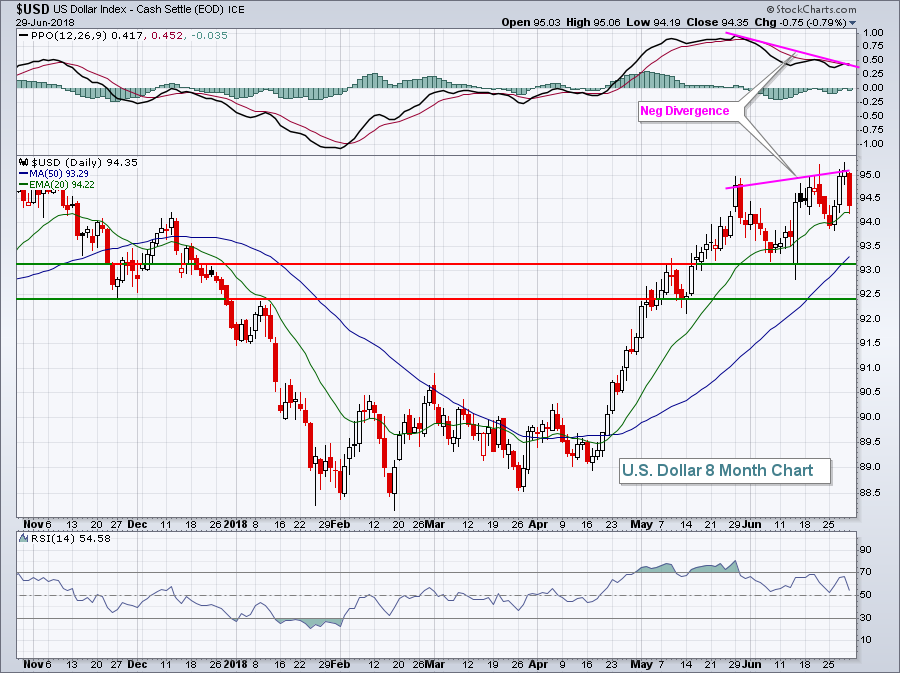
The false breakout on the USD and negative divergence in play suggests an increased likelihood of further weakness in the near-term. The rising 50 day SMA is now at 93.29 and becomes a likely first target. Dollar support from 92.50-93.00 also comes into play now. The bigger picture on the USD still remains bullish, but recent developments now point to a longer period of consolidation in my view. Another breakout above 95.25 would negate these concerns.
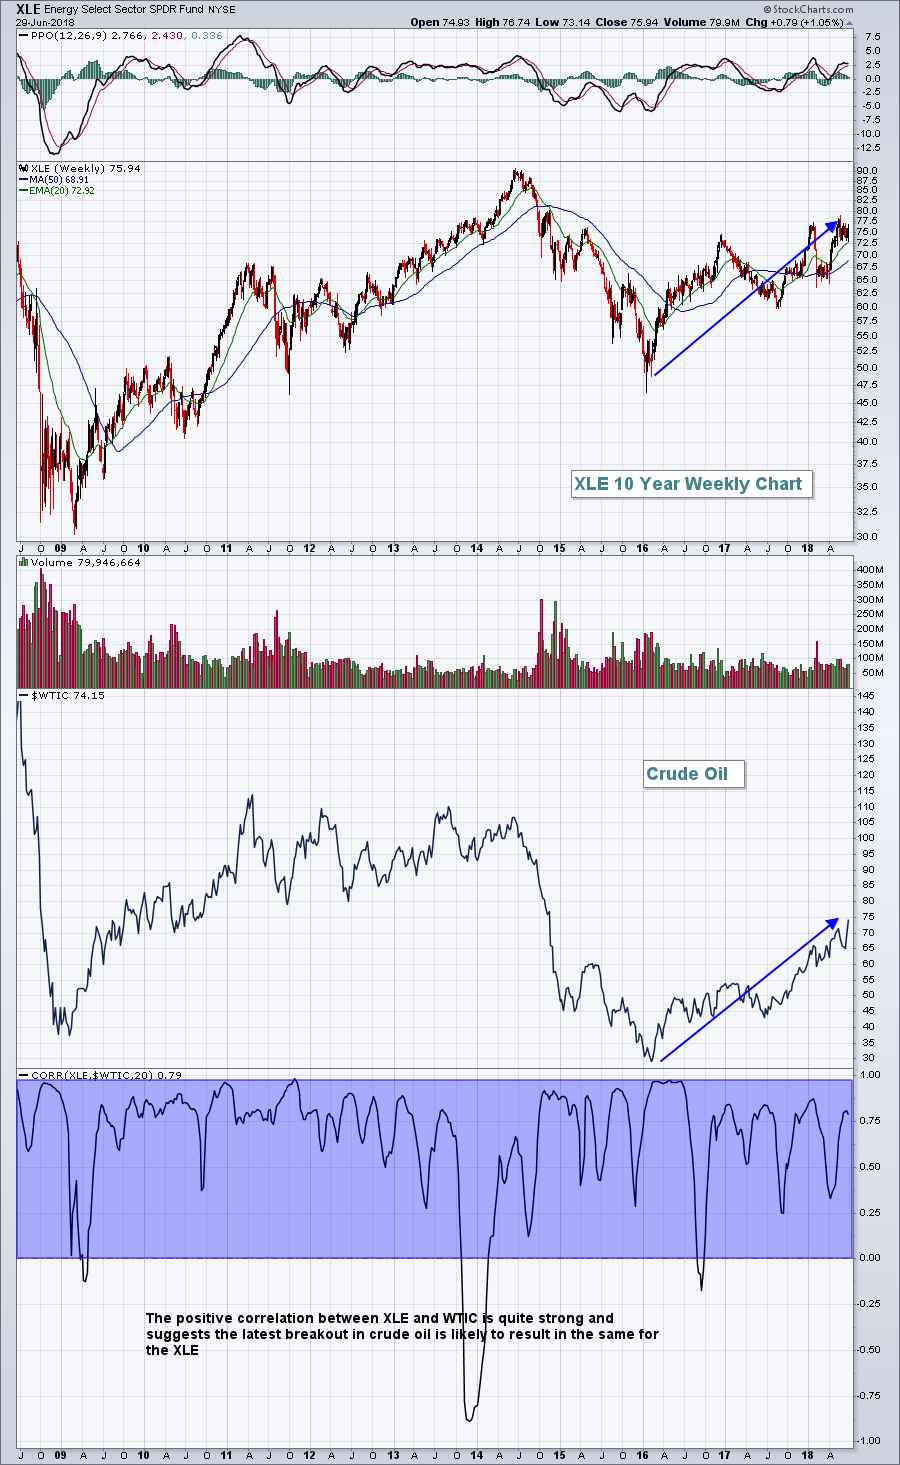
Energy (XLE, +0.62%) was the leading sector on Friday, buoyed by another surge in crude oil prices ($WTIC), which rose to its highest level since the huge decline in the second half of 2014. The XLE and WTIC have a very tight positive correlation, as reflected below:
Nike (NKE) gained more than 11% after reporting blowout quarterly results, sending the Dow Jones U.S. Footwar Index ($DJUSFT) higher by 9.5%. Still, consumer discretionary shares (XLY, +0.17) were only able to finish the day with a minor gain. Consumer staples (XLP, -0.06%) and technology (XLK, -0.04%) trailed all sectors as late day selling on Friday took both sectors into negative territory.
Pre-Market Action
There was considerable weakness in Asian shares overnight with both the Tokyo Nikkei ($NIKK) and Shanghai Composite ($SSEC) down more than 2% on continuing trade concerns. Hong Kong's Hang Seng Index ($HSI) was closed for a holiday. The selling is more moderate in Europe this morning, but key indices there are lower.
U.S. equities appear poised to open the second half of 2018 on a sour note. Dow Jones futures are lower by 140 points with an hour left to the opening bell.
Current Outlook
The NASDAQ 100 contains many of the leaders in the technology and consumer discretionary sectors, where we've seen relative strength in 2018. So it's certainly a proxy for the overall health of the market and worth monitoring:
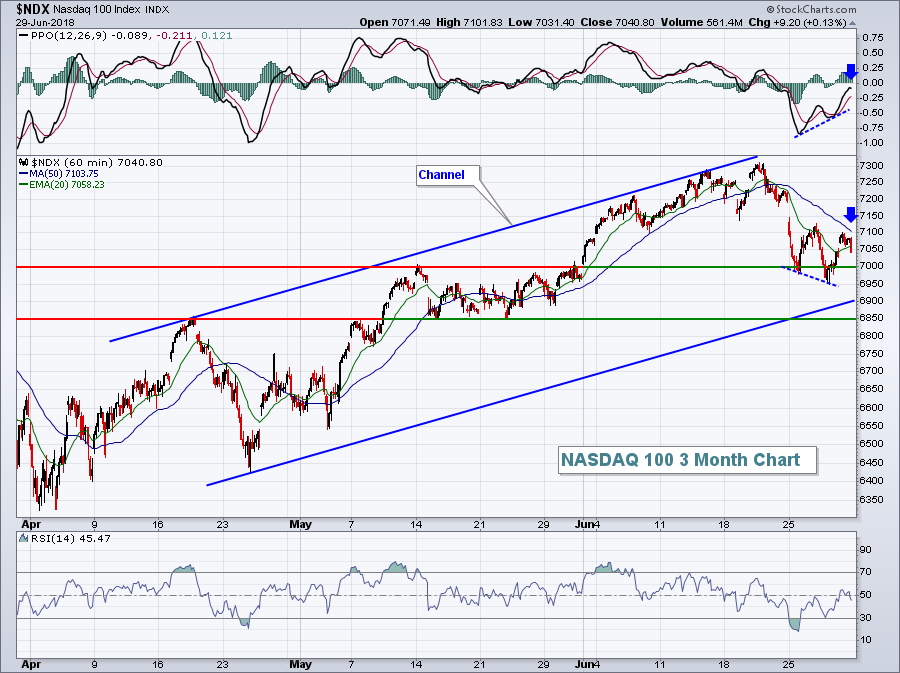
Pullbacks during bull markets are typical and shouldn't be considered anything other than what they are. Recently, we saw a positive divergence develop on the NDX hourly chart and we briefly moved back above 20 hour EMA resistance to approach the 50 hour SMA. Also, note the near PPO centerline test, another technical development I look for after a positive divergence forms. Any further weakness should be contained by the two levels of price support reflected above, along with the possibility of channel support. The bottom channel line was drawn from the late April low using the same slope determined by recent price highs.
Sector/Industry Watch
The financials ETF (XLF) broke down last week beneath price support and attempted recovery on Friday. Unfortunately, it failed beneath its declining 20 day EMA and this suggests lower prices ahead. I remain a fan longer-term of this group as I expect treasury yields to climb in the coming months and into 2019. But I need to see the short-term technical outlook strengthen before I'd grow more bullish. Here's the current look at this group:
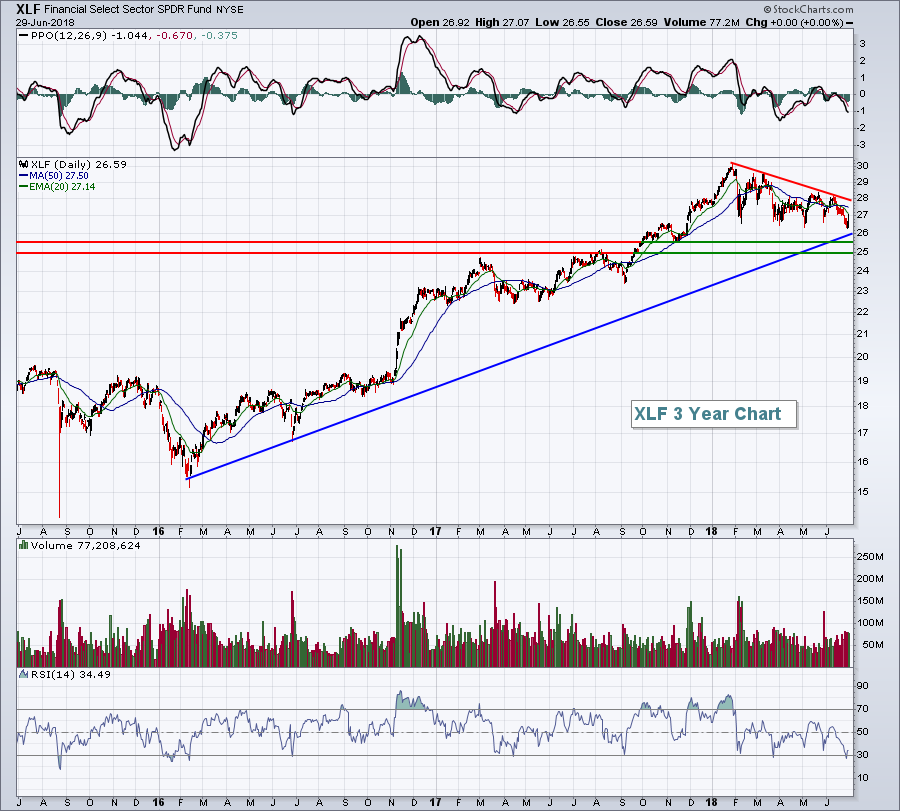
Financials experienced an explosive move higher into early 2018, but since have consolidated. Eventually, I look for a breakout here above the declining red trendline above. Currently, however, there are technical issues to overcome. The XLF must first clear 20 day EMA resistance. Once that occurs, then trendline resistance becomes the next hurdle. To the downside, trendline support and two key levels of price support all reside in the 25-26 zone. As prices move lower, the reward to risk long entry on the XLF improves considerably as I'd maintain an intermediate-term target of 30 to test the late-January high.
Monday Setups
It appears to me that weakness in Zillow Group (ZG) is an opportunity to accumulate. Over the past several months, the heaviest volume days have resulted in gaps lower, followed by hollow candles forming. In other words, just when it appears that ZG is most vulnerable to downside action, buyers step in in droves. Take a look:
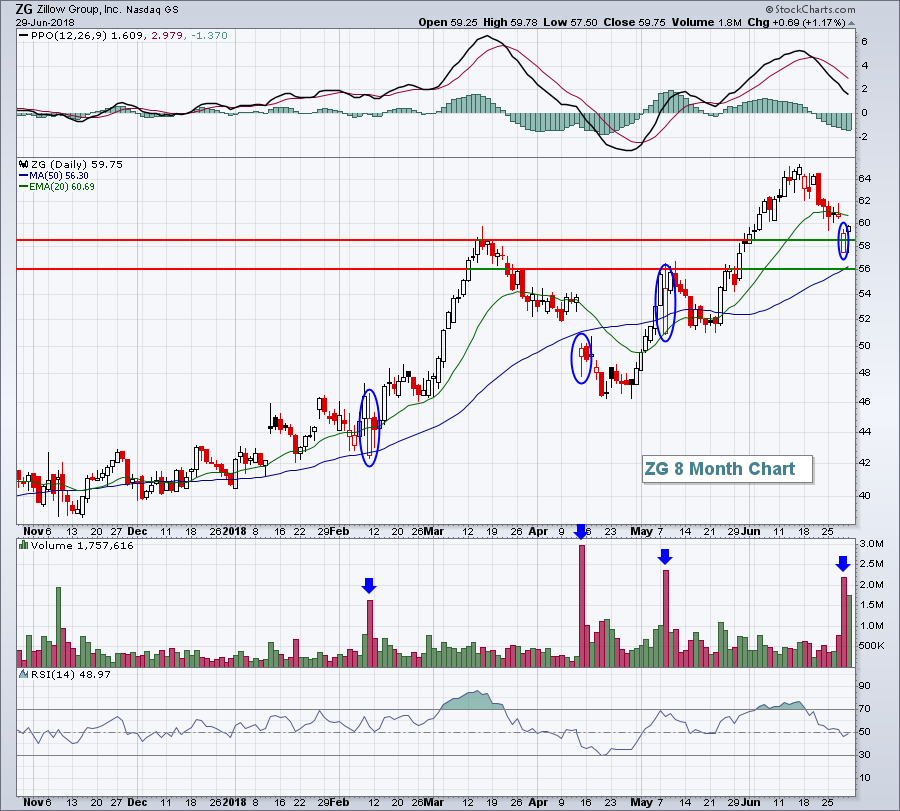
The blue arrows highlight the heavy volume days and, as you can see, all four days resulted in red hollow candles printing. That means ZG saw down days, but closes above the open. There was likely bad news or a bad market each of those days, but buyers came to the rescue. I like entry in ZG at the current price, realizing that best price support likely resides from 56-58. My initial target would be 65.
Historical Tendencies
Here's a breakdown of S&P 500 annualized performance during the month of July since 1950:
July 1-17: +23.94%
July 18-24: -19.29%
July 25-31: +19.51%
Key Earnings Report
None
Key Economic Report
June PMI manufacturing index to be released at 9:45am EST: 54.6 (estimate)
June ISM manufacturing index to be released at 10:00am EST: 58.3 (estimate)
May construction spending to be released at 10:00am EST: +0.6% (estimate)
Happy trading!
Tom
http://stockcharts.com/articles/tradingplaces/2018/07/watch-potential-channel-support-on-the-nasdaq-100.html
• DiscoverGold
By: Tom Bowley | July 2, 2018
The first half of 2018 ended on Friday in bifurcated fashion, which is fitting given that most of 2018 has seen bifurcated action thus far. The NASDAQ gained nearly 9% in the first six months, with the Russell 2000 not too far behind, gaining more than 7%. The S&P 500, however, saw only a 1.7% rise and the Dow Jones ended the first half of the year in negative territory as a rising dollar and trade fears sent traders scurrying out of those large multinational companies, especially those on the Dow Jones. Caterpillar (CAT), for instance, is down roughly 13% in the six months ended June 30.
The rising Dollar Index ($USD) was problematic for large caps, but a boon to smaller issues. As we begin Q3, however, it appears the USD could be in for short-term choppy waters ahead:

The false breakout on the USD and negative divergence in play suggests an increased likelihood of further weakness in the near-term. The rising 50 day SMA is now at 93.29 and becomes a likely first target. Dollar support from 92.50-93.00 also comes into play now. The bigger picture on the USD still remains bullish, but recent developments now point to a longer period of consolidation in my view. Another breakout above 95.25 would negate these concerns.
Energy (XLE, +0.62%) was the leading sector on Friday, buoyed by another surge in crude oil prices ($WTIC), which rose to its highest level since the huge decline in the second half of 2014. The XLE and WTIC have a very tight positive correlation, as reflected below:

Nike (NKE) gained more than 11% after reporting blowout quarterly results, sending the Dow Jones U.S. Footwar Index ($DJUSFT) higher by 9.5%. Still, consumer discretionary shares (XLY, +0.17) were only able to finish the day with a minor gain. Consumer staples (XLP, -0.06%) and technology (XLK, -0.04%) trailed all sectors as late day selling on Friday took both sectors into negative territory.
Pre-Market Action
There was considerable weakness in Asian shares overnight with both the Tokyo Nikkei ($NIKK) and Shanghai Composite ($SSEC) down more than 2% on continuing trade concerns. Hong Kong's Hang Seng Index ($HSI) was closed for a holiday. The selling is more moderate in Europe this morning, but key indices there are lower.
U.S. equities appear poised to open the second half of 2018 on a sour note. Dow Jones futures are lower by 140 points with an hour left to the opening bell.
Current Outlook
The NASDAQ 100 contains many of the leaders in the technology and consumer discretionary sectors, where we've seen relative strength in 2018. So it's certainly a proxy for the overall health of the market and worth monitoring:

Pullbacks during bull markets are typical and shouldn't be considered anything other than what they are. Recently, we saw a positive divergence develop on the NDX hourly chart and we briefly moved back above 20 hour EMA resistance to approach the 50 hour SMA. Also, note the near PPO centerline test, another technical development I look for after a positive divergence forms. Any further weakness should be contained by the two levels of price support reflected above, along with the possibility of channel support. The bottom channel line was drawn from the late April low using the same slope determined by recent price highs.
Sector/Industry Watch
The financials ETF (XLF) broke down last week beneath price support and attempted recovery on Friday. Unfortunately, it failed beneath its declining 20 day EMA and this suggests lower prices ahead. I remain a fan longer-term of this group as I expect treasury yields to climb in the coming months and into 2019. But I need to see the short-term technical outlook strengthen before I'd grow more bullish. Here's the current look at this group:

Financials experienced an explosive move higher into early 2018, but since have consolidated. Eventually, I look for a breakout here above the declining red trendline above. Currently, however, there are technical issues to overcome. The XLF must first clear 20 day EMA resistance. Once that occurs, then trendline resistance becomes the next hurdle. To the downside, trendline support and two key levels of price support all reside in the 25-26 zone. As prices move lower, the reward to risk long entry on the XLF improves considerably as I'd maintain an intermediate-term target of 30 to test the late-January high.
Monday Setups
It appears to me that weakness in Zillow Group (ZG) is an opportunity to accumulate. Over the past several months, the heaviest volume days have resulted in gaps lower, followed by hollow candles forming. In other words, just when it appears that ZG is most vulnerable to downside action, buyers step in in droves. Take a look:

The blue arrows highlight the heavy volume days and, as you can see, all four days resulted in red hollow candles printing. That means ZG saw down days, but closes above the open. There was likely bad news or a bad market each of those days, but buyers came to the rescue. I like entry in ZG at the current price, realizing that best price support likely resides from 56-58. My initial target would be 65.
Historical Tendencies
Here's a breakdown of S&P 500 annualized performance during the month of July since 1950:
July 1-17: +23.94%
July 18-24: -19.29%
July 25-31: +19.51%
Key Earnings Report
None
Key Economic Report
June PMI manufacturing index to be released at 9:45am EST: 54.6 (estimate)
June ISM manufacturing index to be released at 10:00am EST: 58.3 (estimate)
May construction spending to be released at 10:00am EST: +0.6% (estimate)
Happy trading!
Tom
http://stockcharts.com/articles/tradingplaces/2018/07/watch-potential-channel-support-on-the-nasdaq-100.html
• DiscoverGold
Information posted to this board is not meant to suggest any specific action, but to point out the technical signs that can help our readers make their own specific decisions. Your Due Dilegence is a must!
• DiscoverGold
Join the InvestorsHub Community
Register for free to join our community of investors and share your ideas. You will also get access to streaming quotes, interactive charts, trades, portfolio, live options flow and more tools.

