


| Followers | 689 |
| Posts | 143817 |
| Boards Moderated | 35 |
| Alias Born | 03/10/2004 |
Monday, May 28, 2018 8:53:16 AM
By: Hedgopia | May 1, 2018
Gold faced pressure after running into resistance six weeks ago. The subsequent drop cost the metal long-term support at $1,300-plus. Gold bugs were not ready to give in that easy, though. They defended a rising trend line from December 2016. Now, they need to conquer that lost support. Odds are decent.
On April 11, spot gold reached an intraday high of $1,369.40/ounce before retreating. The metal has faced resistance at $1,360-70 since June 2016. Following that unsuccessful test, it went on to lose $1,300-plus. This support goes back to September 2010. On May 21, gold bottomed intraday at $1,281.20.
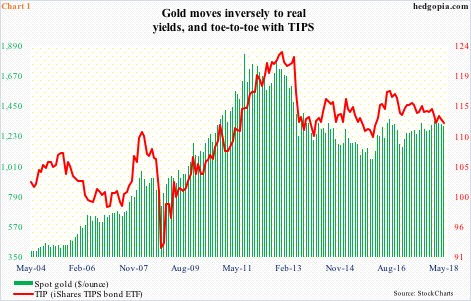
The yellow metal has gone toe-to-toe with TIP (iShares TIPS bond ETF).
TIPS (Treasury inflation-protected securities) pay interest rate as do plain-vanilla Treasury securities. The difference between the two is that the principal of TIPS is adjusted to reflect the change in the CPI. The plain-vanilla securities carry no such inflation protection. Ten-year T-yields, therefore, amount to the 10-year TIPS rate plus expected inflation.
Gold moves inversely to real yields. In other words, it moves in tandem with TIP (Chart 1). Most recently, the latter bottomed on May 17.
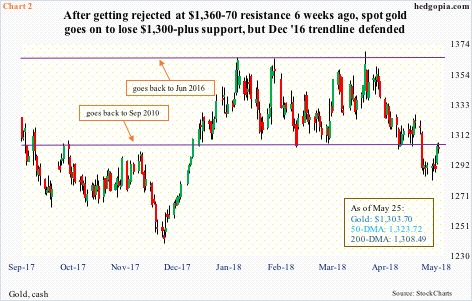
Bids showed up on gold on May 21 at an interesting juncture. A rising trend line from December 2016 draws to $1,280s (Chart 3). Prior to last Thursday’s 1.2 percent rally, there were six straight sessions of long-legged dojis, spinning tops and hammers (Chart 2). After a 6.4-percent, 29-session drop, the bull-bear duel was on. In a long-legged-doji session Friday, gold ($1,303.70) closed right underneath the aforementioned broken support. The 200-day moving average rests right there.
Gold bugs need to take out this resistance. The way bids have showed up in the past several sessions, it is their ball to lose right now.
Incidentally, between April 11 and May 21, GLD (SPDR gold ETF) lost $312 million, while (iShares gold trust) gained $491 million (courtesy of ETF.com). In the aggregate, this was not bad given the decline in the metal’s price.
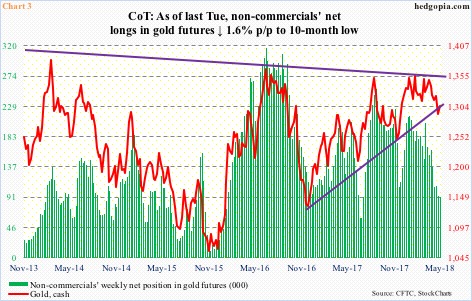
Non-commercials, however, were different. They continued to reduce net longs in gold futures. Most recently, their holdings peaked at 203,354 contracts in the week to March 27. By the week ended April 10, this stood at 155,372. Last Tuesday, this was cut down to 90,957 (Chart 3). For a change, the pace of decline slowed last week, down 1.6 percent week-over-week.
These traders tend to be trend-riders, and do a good job at it. The cash will get a tailwind if they start adding to net longs.
Should things evolve this way, there is room for short squeeze – duration and extent notwithstanding.
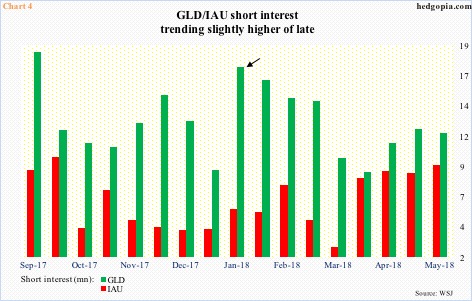
Short interest on GLD is nowhere near the high of mid-January (arrow in Chart 4), but has built up slightly since bottoming at the end of March. There has been a similar buildup in IAU short interest the past couple of months. For this to possibly turn into a tailwind for these ETFs, gold bugs have a task at hand, which is conquering the aforementioned resistance on the cash. Once $1,300-plus is won over, gold’s near-term jigsaw puzzle starts falling into place, particularly drawing in technically-oriented traders.
https://hedgopia.com/dec-16-trend-line-defended-decent-odds-gold-recaptures-broken-support/
• DiscoverGold
Information posted to this board is not meant to suggest any specific action, but to point out the technical signs that can help our readers make their own specific decisions. Your Due Dilegence is a must!
• DiscoverGold
Recent GOLD News
- Porgera Mine Working with UN and Enga Provincial Government to Provide Humanitarian Aid to Violence-Stricken Province • GlobeNewswire Inc. • 09/20/2024 03:35:21 PM
- Barrick Continues to Unlock Value Embedded in Its Asset Base • GlobeNewswire Inc. • 09/17/2024 05:00:29 PM
- Feasibility Study on Lumwana Super Pit Expansion Expected by Year-End • GlobeNewswire Inc. • 09/11/2024 09:00:00 PM
- Key Projects Advance as Barrick Keeps Tight Focus on Value Creation and Growth • GlobeNewswire Inc. • 08/12/2024 10:00:00 AM
- Barrick Declares Q2 Dividend and Buys Back Shares • GlobeNewswire Inc. • 08/12/2024 09:59:00 AM
- U.S. Futures Steady as Markets Await Key Inflation Data, Oil Prices Climb • IH Market News • 08/12/2024 09:47:41 AM
- Mining Plays a Vital Role in Advancing the UN’s Sustainable Development Goals, says Barrick • GlobeNewswire Inc. • 08/02/2024 06:45:39 PM
- Porgera Remains On Track Despite Mulitaka Landslide Challenges • GlobeNewswire Inc. • 07/25/2024 11:00:00 AM
- Higher Q2 Production Puts Barrick On Track to Deliver 2024 Targets • GlobeNewswire Inc. • 07/16/2024 11:00:00 AM
- Barrick Continues to Invest in Mali • GlobeNewswire Inc. • 07/09/2024 07:00:00 PM
- Exploration Success, Capital Investment and Reserve Growth to Sustain Kibali’s Production Profile • GlobeNewswire Inc. • 07/02/2024 04:00:00 PM
- Barrick and Zijin Contribute $1 Million to Support Papua New Guinea Landslide Victims • GlobeNewswire Inc. • 06/07/2024 11:18:39 AM
- Form SD - Specialized disclosure report • Edgar (US Regulatory) • 05/29/2024 08:01:04 PM
- Barrick’s Sustainability Strategy Delivers Real Value to Stakeholders • GlobeNewswire Inc. • 05/15/2024 11:00:00 AM
- Barrick Announces Extensive Exploration Partnership with Geophysx Jamaica • GlobeNewswire Inc. • 05/01/2024 10:15:00 AM
- Barrick to Ramp Up Production As It Remains On Track to Achieve 2024 Targets • GlobeNewswire Inc. • 05/01/2024 10:00:00 AM
- Barrick Declares Q1 Dividend • GlobeNewswire Inc. • 05/01/2024 09:59:00 AM
- Barrick Announces Election of Directors • GlobeNewswire Inc. • 04/30/2024 08:15:55 PM
- Barrick On Track to Achieve 2024 Targets • GlobeNewswire Inc. • 04/16/2024 11:00:00 AM
- Notice of Release of Barrick’s First Quarter 2024 Results • GlobeNewswire Inc. • 04/09/2024 11:00:00 AM
- Strategy-Driven Barrick Builds on Value Foundation • GlobeNewswire Inc. • 03/28/2024 09:20:38 PM
- Barrick Hunts New Gold and Copper Prospects in DRC From Kibali Base • GlobeNewswire Inc. • 03/20/2024 02:00:00 PM
- Barrick Opens Academy at Closed Buzwagi Mine • GlobeNewswire Inc. • 03/18/2024 08:00:00 AM
- Barrick to Grow Production and Value on Global Asset Foundation • GlobeNewswire Inc. • 03/15/2024 11:53:01 AM
- Loulo-Gounkoto Delivers Another Value-Creating Performance • GlobeNewswire Inc. • 03/10/2024 10:00:00 AM
Lingerie Fighting Championships Signs Broadcast Deal With Maybacks Global Entertainment • BOTY • Sep 26, 2024 9:00 AM
Maybacks Global Entertainment and Lingerie Fighting Championships Enter Into Broadcast And Revenue Sharing Agreement • AHRO • Sep 26, 2024 8:30 AM
North Bay Resources Commences Operations at Bishop Gold Mill, Inyo County, California; Engages Sabean Group Management Consulting • NBRI • Sep 25, 2024 9:15 AM
CEO David B. Dorwart Anticipates a Bright Future at Good Gaming Inc. Through His Most Recent Shareholder Update • GMER • Sep 25, 2024 8:30 AM
Cannabix Technologies and Omega Laboratories Inc. Advance Marijuana Breathalyzer Technology - Dr. Bruce Goldberger to Present at Society of Forensic Toxicologists Conference • BLOZF • Sep 24, 2024 8:50 AM
Integrated Ventures, Inc Announces Strategic Partnership For GLP-1 (Semaglutide) Procurement Through MedWell USA, LLC. • INTV • Sep 24, 2024 8:45 AM

