


| Followers | 689 |
| Posts | 143817 |
| Boards Moderated | 35 |
| Alias Born | 03/10/2004 |
Friday, May 04, 2018 8:12:23 AM
By: Tom McClellan | May 3, 2018
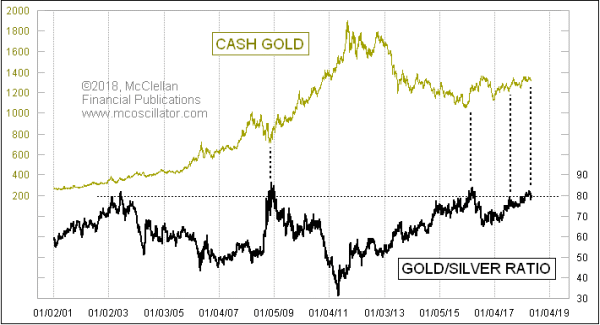
The ratio of gold prices versus silver prices is now up to the type of high reading that in the past 2 decades has marked an important low for both gold and silver prices.
The value of anything is always and in every case a ratio. Most often the units are expressed as dollars per ounce, dollars per bushel, dollars per share, etc. But expressing the price of an ounce of gold as being equivalent to 80 ounces of silver is perfectly legitimate. We can understand the implications of the dollar price of something being expensive or cheap; it takes a little bit more energy to apply that same principle to such a comparison of the two precious metals’ prices, but it is still valid.
A high ratio like this says that gold is expensive relative to silver. But turning that around, it says that silver is cheap relative to gold. And there is information in that cheapness of silver.
Silver is actually the more speculative metal versus gold. I like to say that gold is the dog, and silver is the tail, wagging around a whole lot more wildly. When this ratio gets up to around 80 or above, it means that speculative fervor is at a minimum. Usually that means a bottom for gold (and silver) prices. But sometimes it can mark a point where both are poised for a big breakout move, as was the case back in 2003.
The period from late 2014 to present has seen this ratio stay between 65 and 85. This is the quietest range it has seen in years, implying that something big is brewing. The 8-year cycle says that it should be a big move upward.
One curious point about this ratio is that it has not always worked this way. There was a period in the late 1990s when it worked entirely backwards from what I described above. Here is a chart from that period:
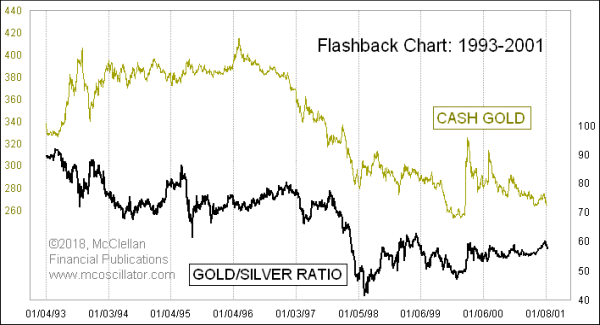
From late 1996 to 2000, the gold/silver ratio showed a positive correlation to gold prices. This was a weird exception to its normal behavior, and one big reason was that the Bank of England was involved in a big sale of its gold reserves. It did not have any silver reserves to sell off, just gold. So the price of gold got driven down, irrespective of the speculative fervor or lack of fervor for precious metals then. Price is a messenger of the balance between supply and demand. So as with the Fed’s 3 different QE problems, if you stomp all over the messenger, you can count on getting a screwy message.
I bring this up as important history for the understanding of how this indicator has behaved under different supply-demand conditions. We are not now in a period when major world central banks are interfering in the gold or silver markets, and so we can reasonably expect that normal indicator rules of behavior should apply. That should mean an up move is coming for these precious metals’ prices.
Tom McClellan
Editor, The McClellan Market Report
https://www.mcoscillator.com/learning_center/weekly_chart/gold_silver_ratio/
• DiscoverGold
Click on "In reply to", for Authors past commentaries
Information posted to this board is not meant to suggest any specific action, but to point out the technical signs that can help our readers make their own specific decisions. Your Due Dilegence is a must!
• DiscoverGold
VHAI - Vocodia Partners with Leading Political Super PACs to Revolutionize Fundraising Efforts • VHAI • Sep 19, 2024 11:48 AM
Dear Cashmere Group Holding Co. AKA Swifty Global Signs Binding Letter of Intent to be Acquired by Signing Day Sports • DRCR • Sep 19, 2024 10:26 AM
HealthLynked Launches Virtual Urgent Care Through Partnership with Lyric Health. • HLYK • Sep 19, 2024 8:00 AM
Element79 Gold Corp. Appoints Kevin Arias as Advisor to the Board of Directors, Strengthening Strategic Leadership • ELMGF • Sep 18, 2024 10:29 AM
Mawson Finland Limited Further Expands the Known Mineralized Zones at Rajapalot: Palokas step-out drills 7 metres @ 9.1 g/t gold & 706 ppm cobalt • MFL • Sep 17, 2024 9:02 AM
PickleJar Announces Integration With OptCulture to Deliver Holistic Fan Experiences at Venue Point of Sale • PKLE • Sep 17, 2024 8:00 AM

