


Wednesday, February 14, 2018 4:49:15 PM
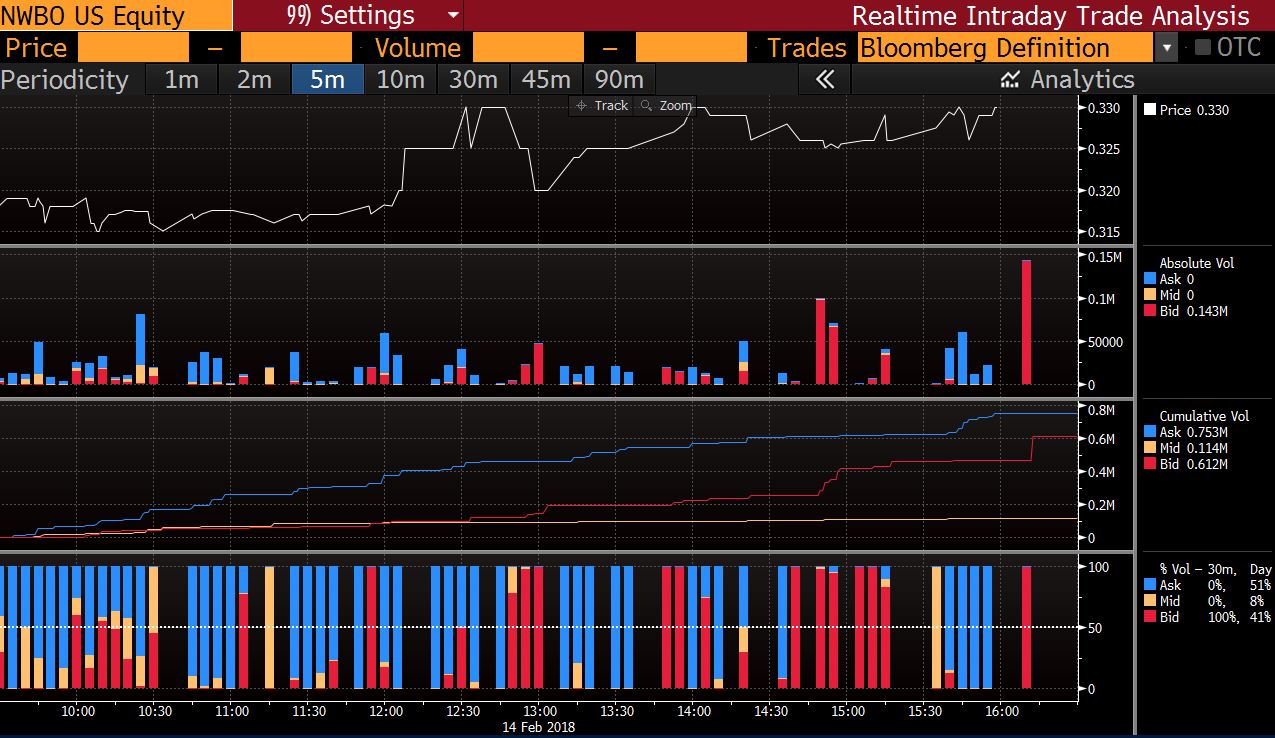
Below are the intraday trades and the blue bars represent trades hitting the ask by a buyer and red indicate trades hitting the bid by a seller (tan are somewhere in the middle of the spread at the time).
Today's Form T after market was 143,500 shares at a price of $0.31707. The bar after market is red only because that trade popped up below the last bid price at close ($0.324).
In the picture below, you can see that in order for someone to have such a low average price today, the action had to almost completely occur in the first half of the day. You can see that thru noon, almost all of the action was hitting the ASK. In the 10:25-10:30 interval 20k hit the mid followed by 60k at the ask.
Today, with a low of $0.315 and a high of $0.33 and most of the volume coming at or above $0.32...an average price of $0.31707 had to be a buyer.
Recent NWBO News
- Form 10-Q - Quarterly report [Sections 13 or 15(d)] • Edgar (US Regulatory) • 05/10/2024 09:04:57 PM
- Form NT 10-K - Notification of inability to timely file Form 10-K 405, 10-K, 10-KSB 405, 10-KSB, 10-KT, or 10-KT405 • Edgar (US Regulatory) • 03/01/2024 10:04:38 PM
- Form 4 - Statement of changes in beneficial ownership of securities • Edgar (US Regulatory) • 12/02/2023 01:31:35 AM
- Form 8-K - Current report • Edgar (US Regulatory) • 11/16/2023 10:11:54 PM
- Epazz, Inc. (OTC Pink: EPAZ) ZenaDrone Demonstration to Defense Departments of UAE and Saudi Arabia • InvestorsHub NewsWire • 11/15/2023 12:19:31 PM
- Form 10-Q - Quarterly report [Sections 13 or 15(d)] • Edgar (US Regulatory) • 11/09/2023 09:30:39 PM
- Epazz, Inc. (OTC Pink: EPAZ) US Navy Collaboration ZenaDrone 1000 • InvestorsHub NewsWire • 11/09/2023 01:00:34 PM
- Epazz, Inc. (OTC Pink: EPAZ) US Navy Collaboration ZenaDrone 1000 Extreme Weather Demo • InvestorsHub NewsWire • 11/07/2023 12:29:43 PM
- Form 10-Q - Quarterly report [Sections 13 or 15(d)] • Edgar (US Regulatory) • 08/09/2023 08:36:14 PM
Branded Legacy, Inc. Unveils Collaboration with Celebrity Tattoo Artist Kat Tat for New Tattoo Aftercare Product • BLEG • May 22, 2024 8:30 AM
"Defo's Morning Briefing" Set to Debut for "GreenliteTV" • GRNL • May 21, 2024 2:28 PM
North Bay Resources Announces 50/50 JV at Fran Gold Project, British Columbia; Initiates NI 43-101 Resources Estimate and Bulk Sample • NBRI • May 21, 2024 9:07 AM
Greenlite Ventures Inks Deal to Acquire No Limit Technology • GRNL • May 17, 2024 3:00 PM
Music Licensing, Inc. (OTC: SONG) Subsidiary Pro Music Rights Secures Final Judgment of $114,081.30 USD, Demonstrating Strength of Licensing Agreements • SONGD • May 17, 2024 11:00 AM
VPR Brands (VPRB) Reports First Quarter 2024 Financial Results • VPRB • May 17, 2024 8:04 AM

