Volatility Indexes for NDX ($VXN) and Gold ($GVC) Suggest Rally Pop Ahead By: Erin Swenlin | January 25, 2018
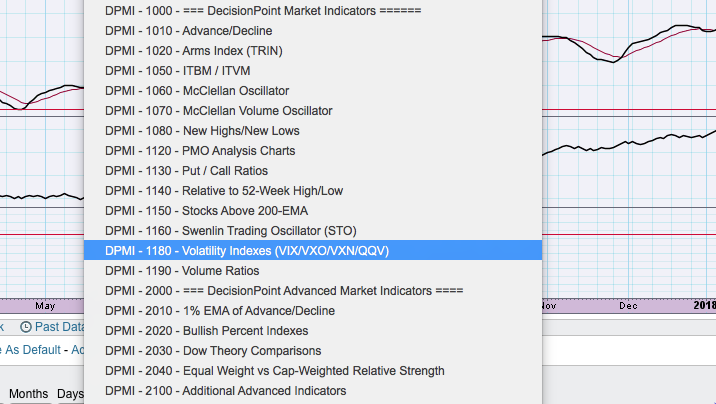
Many of you may not be aware, but DecisionPoint has charts for most of the volatility indexes in the DecisionPoint Market Indicator ChartPack. We're in the process of updating the ChartPack, but there's no reason you can't download it now and enjoy the plethora of indicators available to you for most major indexes. I hadn't looked at this ChartList with the volatility indexes in a very long time. I primarily use the volatility index as a very short-term sentiment indicator. Based on the NDX and Gold volatility indexes, I'm expecting a "rally pop". I have no idea if this is my own term or if I picked it up somewhere along the way, but it means a few hours or a day or two of rally. Many times these 'pops' find continuation if the conditions are ripe.
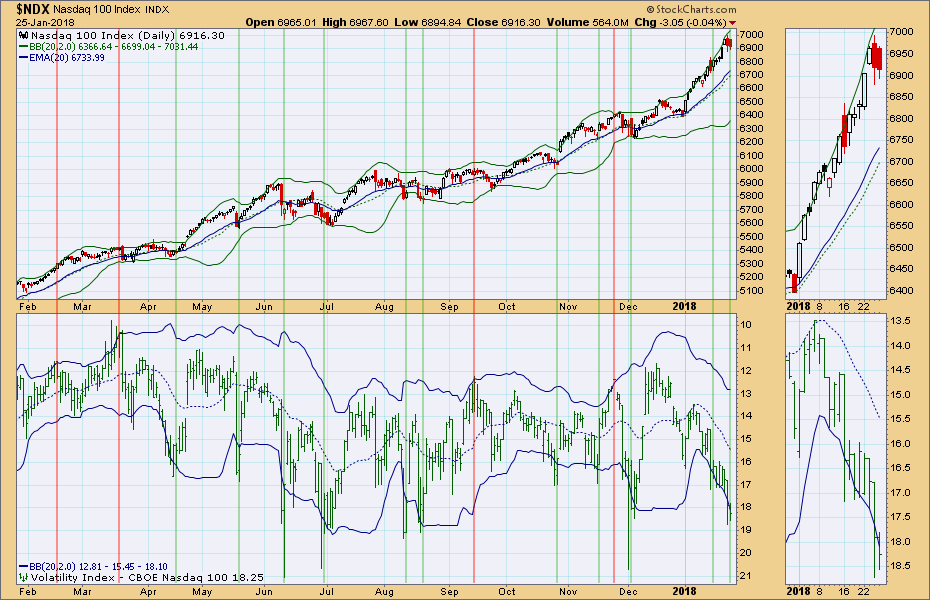
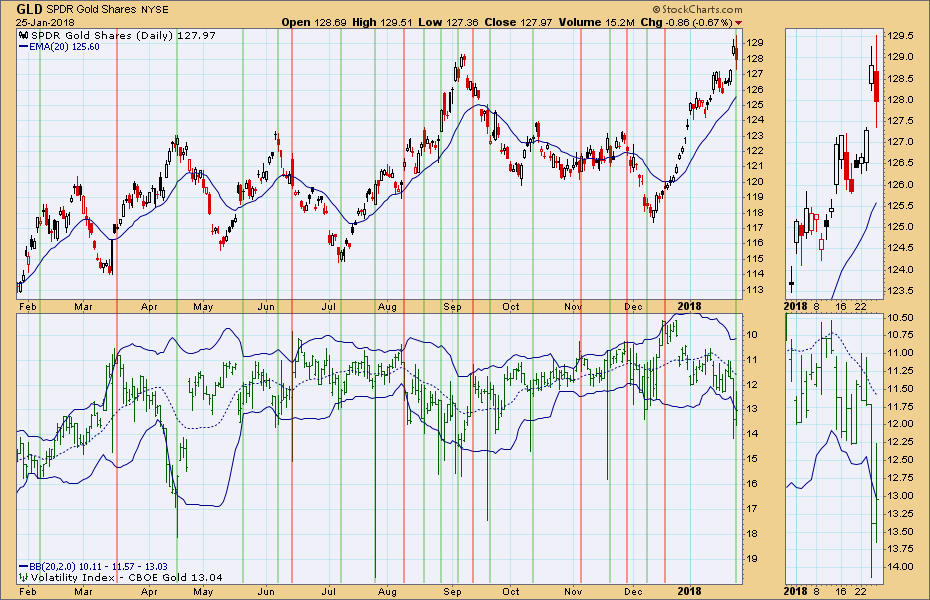
I use an inverted scale on the $VIX or in this case $VNX and $GVC. My reasoning is simple. These indexes measure the 'fear factor' or sentiment. The higher the reading on the VIX, the more fearful or bearish investors are feeling. Sentiment being contrarian, when these numbers are very high it's bullish, conditions are "oversold" and suggest a quick rally or rally pop. I like to see "oversold" on the bottom of the pane, not the top so that's why I invert the scale. Using Bollinger Band penetrations on the upside (overbought) and on the downside (oversold) on the inverted scale, the picture is more intuitive as overbought is on the top and oversold is on the bottom.
Below are the charts for the NDX and Gold (GLD) with their respective volatility indexes on inverted scales. I've highlighted in green the oversold conditions that generally result in a rally pop and in red the overbought conditions that usually end with a decline. We're seeing some very high readings on the $VXN and $GVC which means that sentiment is bearish. On both charts we see declines in place. I propose that based on these oversold readings on the VXN and GVC, we should look for a rally tomorrow or Monday.
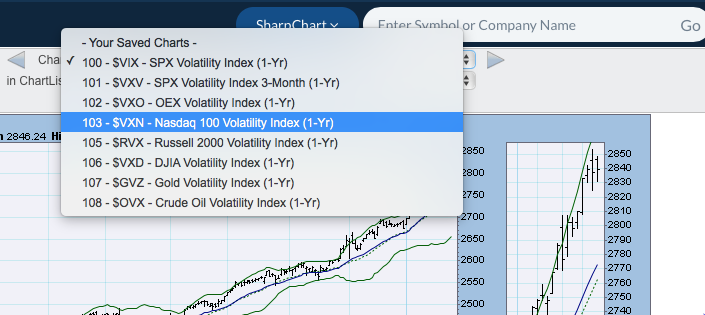
While the accuracy isn't perfect, it's got a great track record and many times the price decline or rally extend further. Below is a picture of the ChartLists included in the DecisionPoint Market Indicator ChartPack and then a picture of all the ready-made volatility index charts.
Technical Analysis is a windsock, not a crystal ball.
Information posted to this board is not meant to suggest any specific action, but to point out the technical signs that can help our readers make their own specific decisions. Your Due Dilegence is a must! • DiscoverGold
Register for free to join our community of investors and share your ideas. You will also get access to streaming quotes, interactive charts, trades, portfolio, live options flow and more tools.


 News
News  Market Data
  Discover