


| Followers | 2721 |
| Posts | 55287 |
| Boards Moderated | 4 |
| Alias Born | 08/10/2012 |
Tuesday, January 16, 2018 12:49:27 PM
BASIC CANDLESTICKS PATTERNS
Upside Tasuki Gap — A continuation pattern with a long white body followed by another white body that has gapped above the first one. The third day is black and opens within the body of the second day, then closes in the gap between the first two days, but does not close the gap.

Upside Gap Two Crows — A three-day bearish pattern that only happens in an uptrend. The first day is a long white body followed by a gapped open with the small black body remaining gapped above the first day. The third day is also a black day whose body is larger than the second day and engulfs it. The close of the last day is still above the first long white day.
Three White Soldiers — A bullish reversal pattern consisting of three consecutive long white bodies. Each should open within the previous body and the close should be near the high of the day.

Three Black Crows — A bearish reversal pattern consisting of three consecutive long black bodies where each day closes at or near its low and opens within the body of the previous day.
Three Inside Up — This is a confirmed Bullish Harami pattern. The first two candlesticks are exactly the same as the Bullish Harami, and the third day represents bullish confirmation.
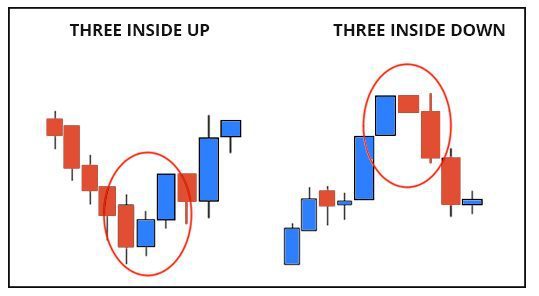
Three Inside Down — This is a confirmed Bearish Harami pattern. The first two lines are exactly the same as the Bearish Harami, and the third day represents bearish confirmation.
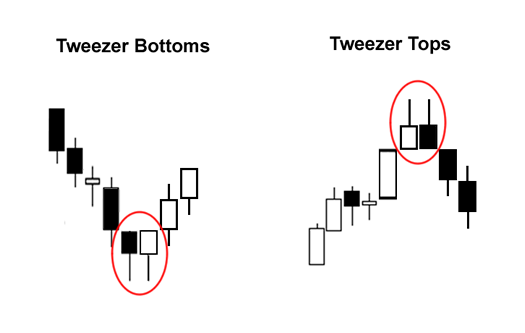
Tweezer Tops and Bottoms — The Tweezer Top formation is viewed as a bearish reversal pattern seen at the top of uptrends and the Tweezer Bottom formation is viewed as a bullish reversal pattern seen at the bottom of downtrends.
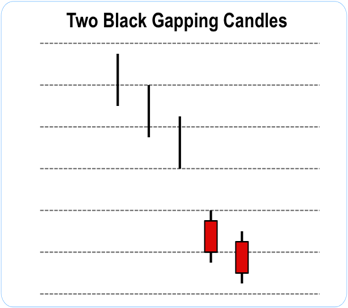
Two Black Gapping — The bearish two black gapping continuation pattern appears after a notable top in an uptrend, with a gap down that yields two black bars posting lower lows. This pattern predicts that the decline will continue to even lower lows, perhaps triggering a broader-scale downtrend. According to Bulkowski, this pattern predicts lower prices with a 68% accuracy rate.
Stick Sandwich — A bullish reversal pattern with two black bodies surrounding a white body. The closing prices of the two black bodies must be equal. A support price is apparent and the opportunity for prices to reverse is quite good.

Squeeze Alert — This is a three-day bullish reversal pattern. It was developed because of the frequent event where prices can break to the upside following this pattern, especially if the pattern is preceded by a strong downside move.

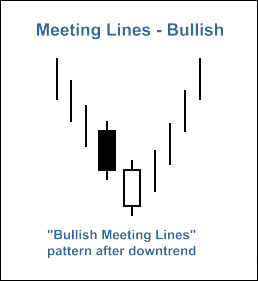
Meeting Line — This pattern occurs during a downtrend. The first day’s black candlestick is followed by a white candlestick that opens sharply lower and closes at the same level as the prior session’s close. It is similar to the Piercing Line pattern. However, the amount the second day rebounds is different.
Stars — A candlestick that gaps away from the previous candlestick is said to be in star position. Depending on the previous candlestick, the star position candlestick gaps up or down and appears isolated from previous price action.

Spinning Top — Candlestick lines that have small bodies with upper and lower shadows that exceed the length of the body. Spinning tops signal indecision.

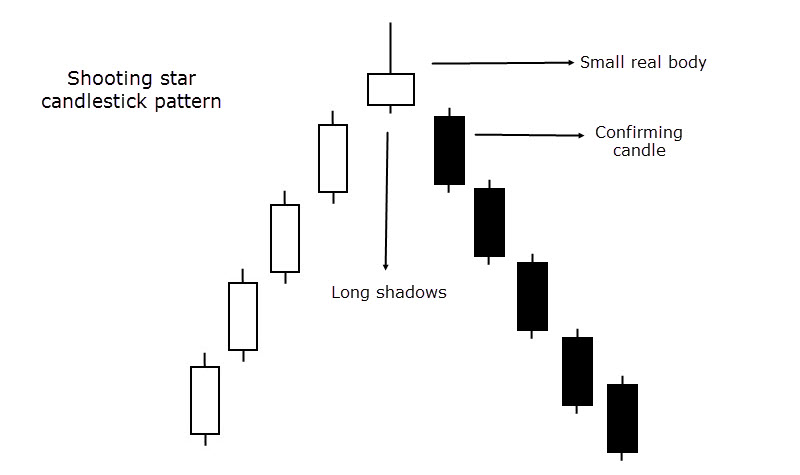
Shooting Star — A single day pattern that can appear in an uptrend. It opens higher, trades much higher, then closes near its open. It looks just like the Inverted Hammer except that it is bearish.
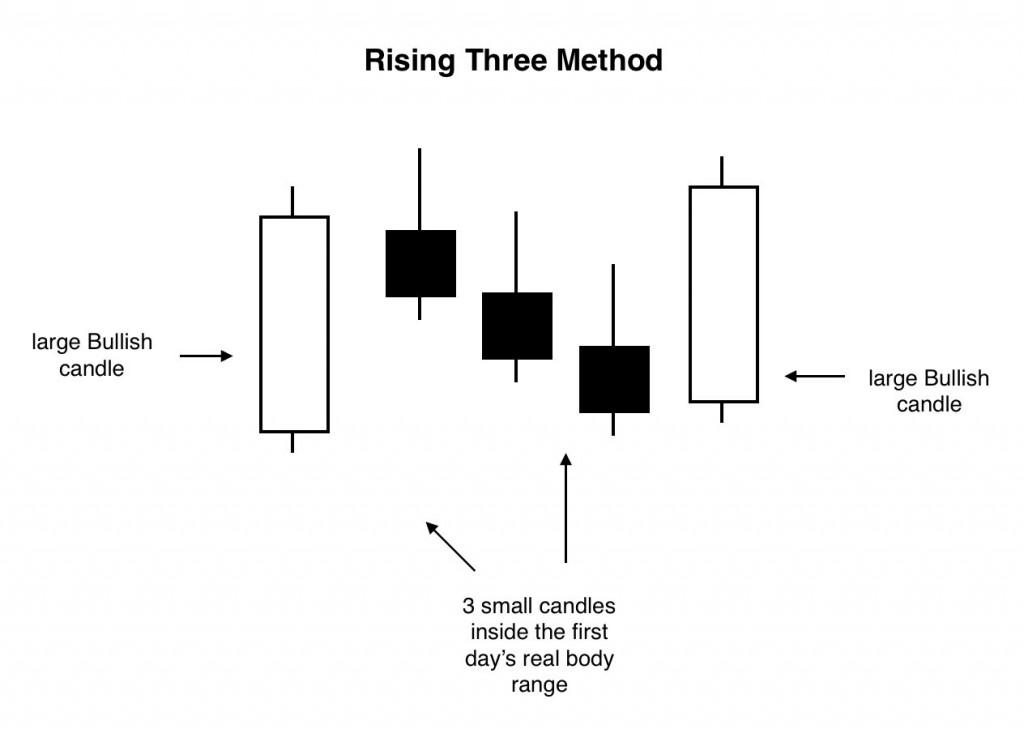
Rising Three Methods — A bullish continuation pattern in which a long white body is followed by three small body days, each fully contained within the range of the high and low of the first day. The fifth day closes at a new high.
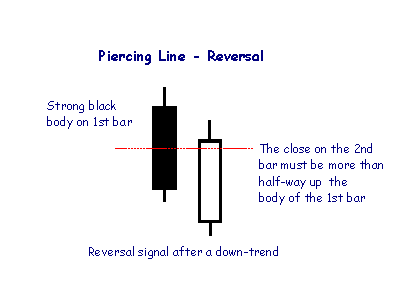
Piercing Line — A bullish two-day reversal pattern. The first day, in a downtrend, is a long black day. The next day opens at a new low, then closes above the midpoint of the body of the first day.
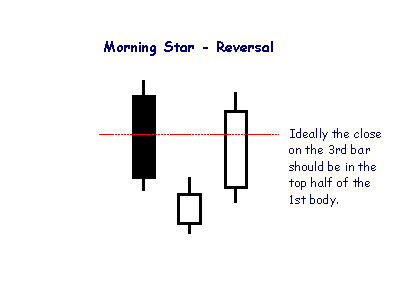
Morning Star — A three-day bullish reversal pattern consisting of three candlesticks - a long-bodied black candle extending the current downtrend, a short middle candle that gapped down on the open, and a long-bodied white candle that gapped up on the open and closed above the midpoint of the body of the first day.
Morning Doji Star — A three-day bullish reversal pattern that is very similar to the Morning Star. The first day is in a downtrend with a long black body. The next day opens lower with a Doji that has a small trading range. The last day closes above the midpoint of the first day.
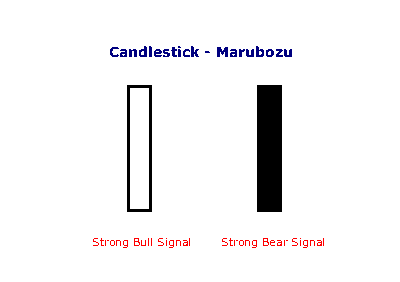
Marubozu — A candlestick with no shadow extending from the body at either the open, the close or at both. The name means close-cropped or close-cut in Japanese, though other interpretations refer to it as Bald or Shaven Head.
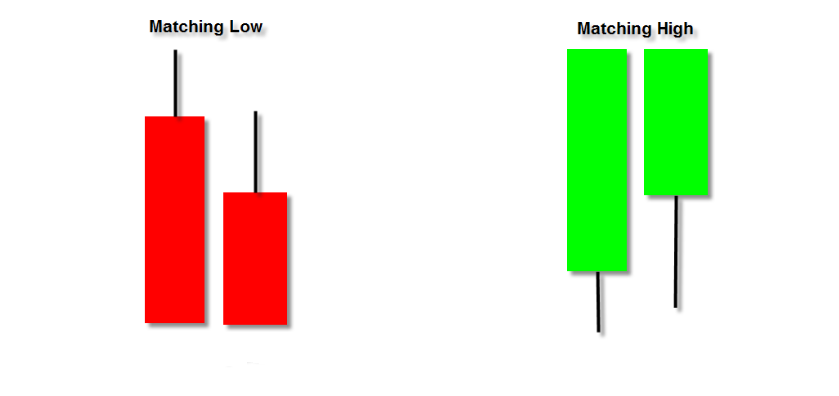
Matching Low — This pattern occurs when two black days appear with equal closes in a downtrend. Matching Low indicates a bottom has been made, even though the new low was tested and there was no follow through, which is indicative of a good support price.
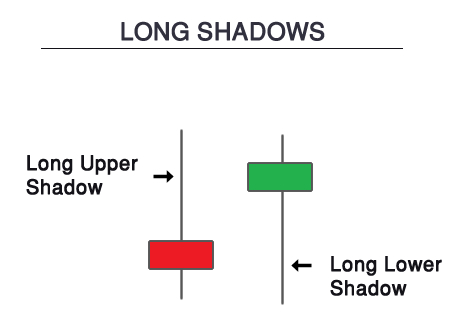
Long Shadows — Candlesticks with a long upper shadow and short lower shadow indicate that buyers dominated during the first part of the session, bidding prices higher. Conversely, candlesticks with long lower shadows and short upper shadows indicate that sellers dominated during the first part of the session, driving prices lower.
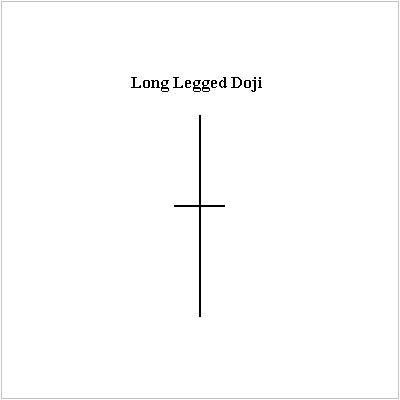
Long-Legged Doji — This candlestick has long upper and lower shadows with the Doji in the middle of the day's trading range, clearly reflecting the indecision of traders.
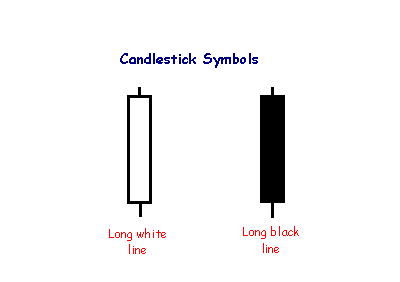
Long Body — A long day represents a large price move from open to close, where the length of the candle body is long.
Ladder Bottom — This is a five candlestick pattern that starts with three strong black candlesticks. The downtrend continues with the fourth lower close. The next day gaps higher and closes much higher than the previous day or two. This may imply a bullish reversal.

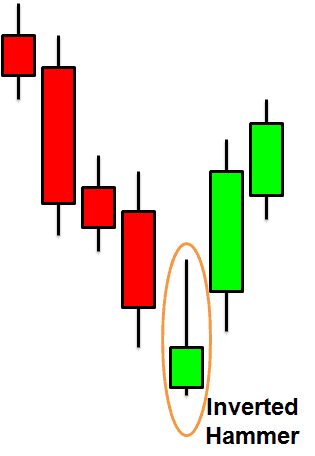
Inverted Hammer — A one-day bullish reversal pattern. In a downtrend, the open is lower, then it trades higher, but closes near its open, therefore looking like an inverted lollipop.
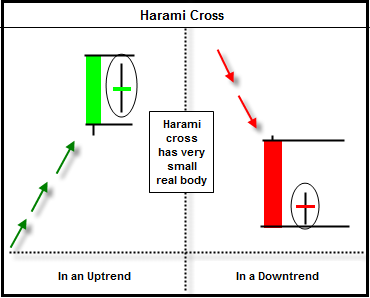
Harami Cross — A two-day pattern similar to the Harami. The difference is that the last day is a Doji.
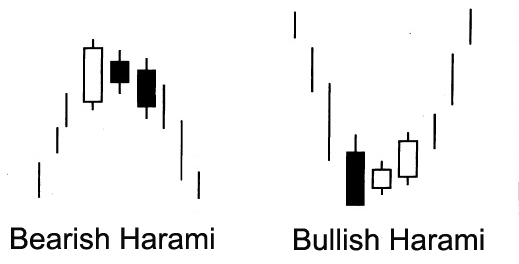
Harami — A two-day pattern that has a small body day completely contained within the range of the previous body, and is the opposite color.
Hanging Man — The pattern occurs at the top of a trend or during an uptrend. The name Hanging Man comes from the fact that the candlestick looks somewhat like a hanging man. It is a single candlestick pattern that has a long lower shadow and a small body at or very near the top of its daily trading range.
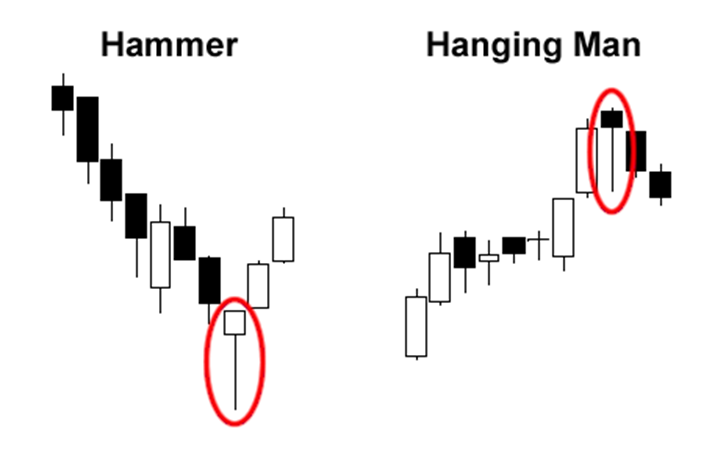
Hammer — This pattern occurs at the bottom of a trend or during a downtrend and it is called a Hammer since it is hammering out of a bottom. It is a single candlestick pattern that has a long lower shadow and a small body at or very near the top of its daily trading range.
Homing Pigeon — This pattern is a small black body contained by a prior relatively long black body. It resembles the Harami pattern, except that both bodies are black.

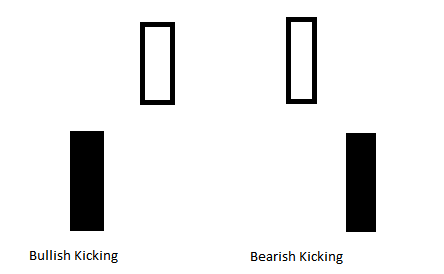
Kicking — This pattern consists firstly of a black Marubozu and then a white Marubozu. After the black Marubozu, the market opens above the prior session’s opening, forming a gap between the two candlesticks.
Gravestone Doji — A doji line that develops when the Doji is at, or very near, the low of the day.
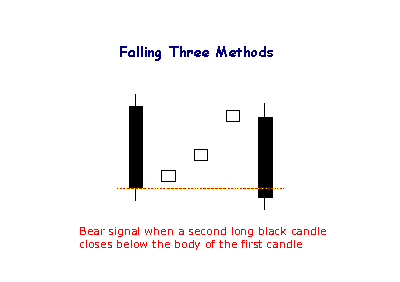
Falling Three Methods — A bearish continuation pattern. A long black body is followed by three small body days, each fully contained within the range of the high and low of the first day. The fifth day closes at a new low.
Falling Window Pattern — The same as a Western gap. Windows are continuation candlestick patterns. If a window opens in a selloff, it is a falling window. This is a bearish signal. The falling window is resistance.
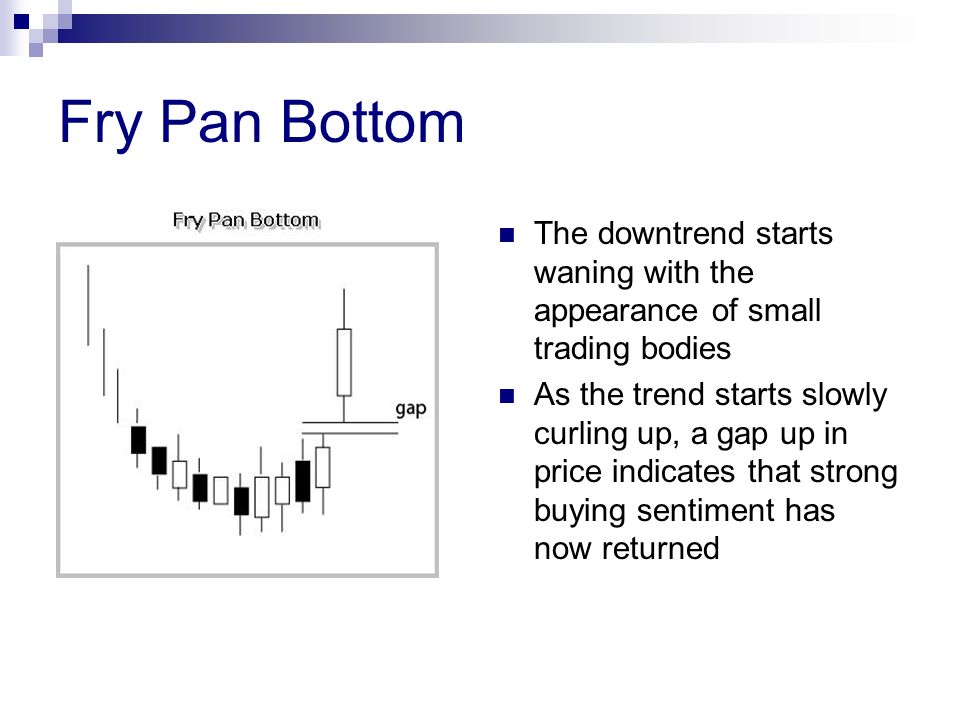
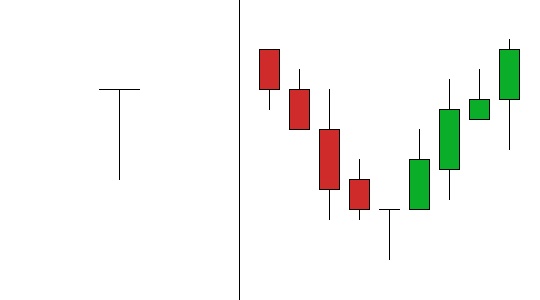
Frying Pan Bottom Pattern — The fry pan bottom occurs when small real body candlesticks slowly move downward and then move in a neutral to upward direction. The fry pan bottom pattern is complete when a bullish candlestick gaps up from the rest of the candlesticks.
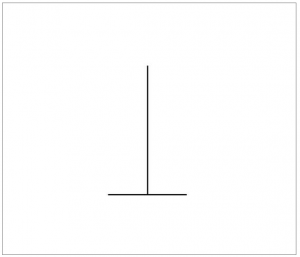
Four Price Doji — This candlestick is simply a horizontal line that has no upper and lower shadows.
https://investorshub.advfn.com/uimage/uploads/2018/1/15/cfzwjFour_Price_Doji.jpg
Evening Star — This is a three-candlestick pattern signaling a major top reversal. It is composed of a white candlestick followed by a short candlestick, which characteristically gaps up to form a star. Then we have a third black candlestick whose closing is well into the first session’s white body. This is a meaningful top pattern.

Evening Doji Star — A three-day bearish reversal pattern similar to the Evening Star. The uptrend continues with a large white body. The next day opens higher, trades in a small range, then closes at its open (Doji). The next day closes below the midpoint of the body of the first day.

Engulfing Pattern — A reversal pattern that can be bearish or bullish, depending upon whether it appears at the end of an uptrend (bearish engulfing pattern) or a downtrend (bullish engulfing pattern). The first day is characterized by a small body, followed by a day whose body completely engulfs the previous day's body and closes in the opposite direction of the trend. This pattern is similar to the outside reversal chart pattern, but does not require the entire range (high and low) to be engulfed, just the open and close.

Dragonfly Doji — A Doji where the open and close price are at the high of the day. Like other Doji days, this one normally appears at market turning points.
Downside Tasuki Gap — A continuation pattern with a long, black body followed by another black body that has gapped below the first one. The third day is white and opens within the body of the second day, then closes in the gap between the first two days, but does not close the gap.
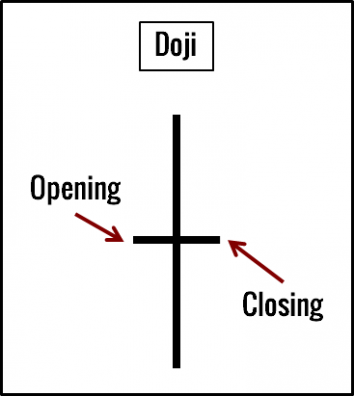
Doji — Doji form when a security's open and close are virtually equal. The length of the upper and lower shadows can vary, and the resulting candlestick looks like, either, a cross, inverted cross, or plus sign. Doji convey a sense of indecision or tug-of-war between buyers and sellers. Prices move above and below the opening level during the session, but close at or near the opening level.
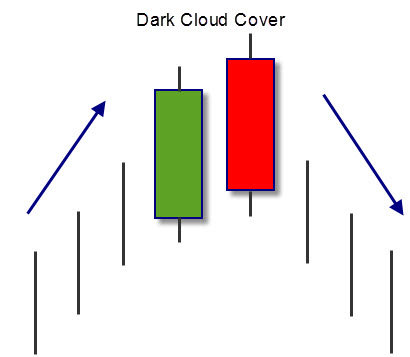
Dark Cloud Cover — A bearish reversal pattern that continues the uptrend with a long white body. The next day opens at a new high then closes below the midpoint of the body of the first day.
Concealing Baby Swallow — This is a pattern formed by four black candlesticks. After two falling Black Marubozu days, a short down day engulfed by a fourth black day shows that the downtrend has eroded significantly, despite the final close is at a new low.
Breakaway — This five candlestick pattern starts with a strong black candlestick. The next three days after the downside gap set consecutively lower prices. However, the last day completely erases the limited losses of down days and closes inside the gap between the first and second days. This suggests a short term reversal.

Bullish Side-by-Side White Lines — Two consecutive white candlesticks that have the same open and whose real bodies are about the same size. In an uptrend, if these side-by-side white lines gap higher, it is a bullish continuation candlestick pattern. In a downtrend, on Japanese candlestick charts these side-by-side white lines are still considered bearish (in spite of their white candles since they come after a falling gap).
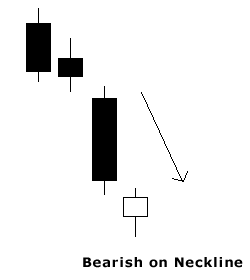
Bearish On Neck Pattern — The on neck pattern occurs when a long bearish candle is followed by a short bullish candle that fails to close above the prior candle’s close and represents a bearish continuation pattern.
Belt Hold — Bullish Belt Hold is a single candlestick pattern, basically, a White Opening Marubozu that occurs in a downtrend. It opens on the low of the day, and then a rally begins during the day against the overall trend of the market, which eventually stops with a close near the high, leaving a small shadow on top of the candle. If longer bodies characterize the Belt Hold, then the resistance they offer against the trend will be even much stronger.

Abandoned Baby — A rare reversal pattern characterized by a gap followed by a Doji, which is then followed by another gap in the opposite direction. The shadows on the Doji must completely gap below or above the shadows of the first and third day.
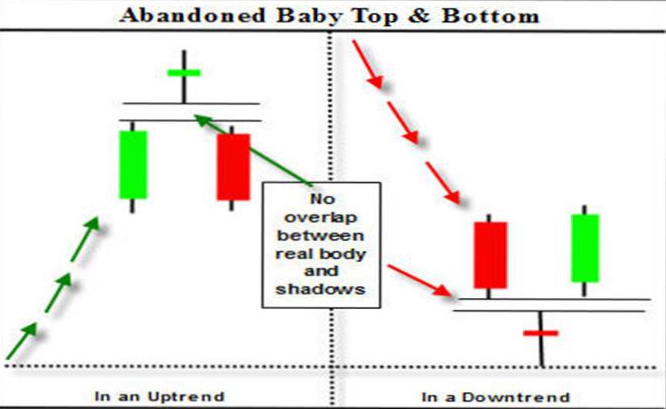
Chart Patterns
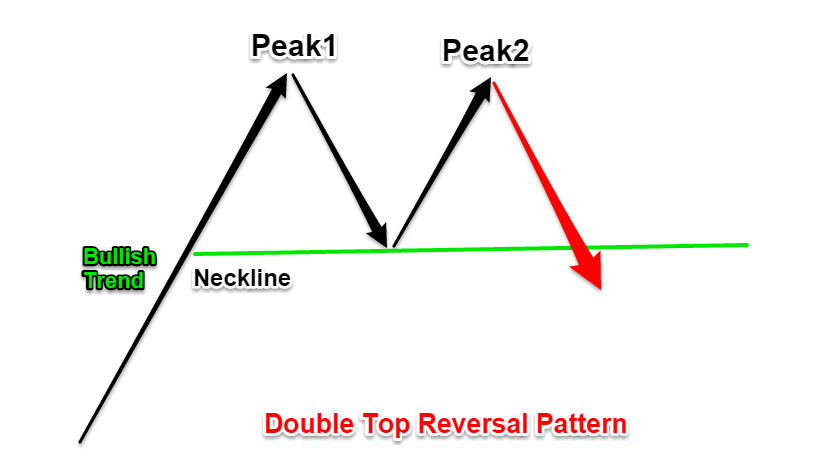
Double Top Reversal — The Double Top Reversal is a bearish reversal pattern typically found on bar charts, line charts, and candlestick charts. As its name implies, the pattern is made up of two consecutive peaks that are roughly equal, with a moderate trough in-between.
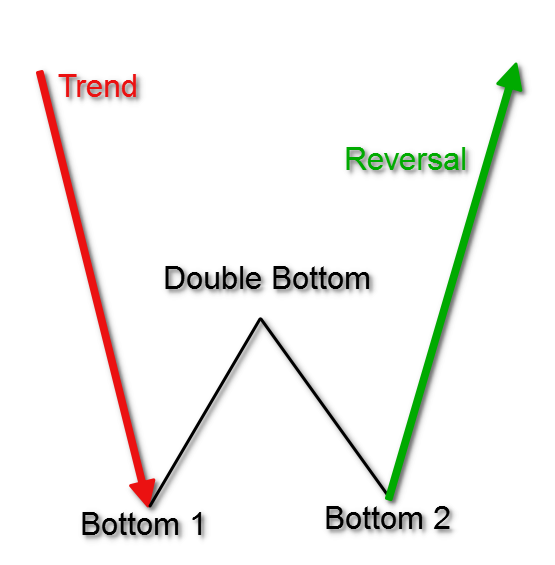
Double Bottom Reversal — The Double Bottom Reversal is a bullish reversal pattern typically found on bar charts, line charts, and candlestick charts. As its name implies, the pattern is made up of two consecutive troughs that are roughly equal, with a moderate peak in-between.
Head and Shoulders Top — A Head and Shoulders reversal pattern forms after an uptrend, and its completion marks a trend reversal. The pattern contains three successive peaks with the middle peak (head) being the highest and the two outside peaks (shoulders) being low and roughly equal. The reaction lows of each peak can be connected to form support, or a neckline.
Head and Shoulders Bottom — The Head and Shoulders Bottom, sometimes referred to as an Inverse Head and Shoulders, is a pattern that shares many common characteristics with its comparable partner, but relies more heavily on volume patterns for confirmation.
As a major reversal pattern, the Head and Shoulders Bottom forms after a downtrend, and its completion marks a change in trend. The pattern contains three successive troughs with the middle trough (head) being the deepest and the two outside troughs (shoulders) being shallower. Ideally, the two shoulders would be equal in height and width. The reaction highs in the middle of the pattern can be connected to form resistance, or a neckline.

Upside Tasuki Gap — A continuation pattern with a long white body followed by another white body that has gapped above the first one. The third day is black and opens within the body of the second day, then closes in the gap between the first two days, but does not close the gap.

Upside Gap Two Crows — A three-day bearish pattern that only happens in an uptrend. The first day is a long white body followed by a gapped open with the small black body remaining gapped above the first day. The third day is also a black day whose body is larger than the second day and engulfs it. The close of the last day is still above the first long white day.

Three White Soldiers — A bullish reversal pattern consisting of three consecutive long white bodies. Each should open within the previous body and the close should be near the high of the day.

Three Black Crows — A bearish reversal pattern consisting of three consecutive long black bodies where each day closes at or near its low and opens within the body of the previous day.
Three Inside Up — This is a confirmed Bullish Harami pattern. The first two candlesticks are exactly the same as the Bullish Harami, and the third day represents bullish confirmation.

Three Inside Down — This is a confirmed Bearish Harami pattern. The first two lines are exactly the same as the Bearish Harami, and the third day represents bearish confirmation.
Tweezer Tops and Bottoms — The Tweezer Top formation is viewed as a bearish reversal pattern seen at the top of uptrends and the Tweezer Bottom formation is viewed as a bullish reversal pattern seen at the bottom of downtrends.

Two Black Gapping — The bearish two black gapping continuation pattern appears after a notable top in an uptrend, with a gap down that yields two black bars posting lower lows. This pattern predicts that the decline will continue to even lower lows, perhaps triggering a broader-scale downtrend. According to Bulkowski, this pattern predicts lower prices with a 68% accuracy rate.

Stick Sandwich — A bullish reversal pattern with two black bodies surrounding a white body. The closing prices of the two black bodies must be equal. A support price is apparent and the opportunity for prices to reverse is quite good.

Squeeze Alert — This is a three-day bullish reversal pattern. It was developed because of the frequent event where prices can break to the upside following this pattern, especially if the pattern is preceded by a strong downside move.

Meeting Line — This pattern occurs during a downtrend. The first day’s black candlestick is followed by a white candlestick that opens sharply lower and closes at the same level as the prior session’s close. It is similar to the Piercing Line pattern. However, the amount the second day rebounds is different.

Stars — A candlestick that gaps away from the previous candlestick is said to be in star position. Depending on the previous candlestick, the star position candlestick gaps up or down and appears isolated from previous price action.

Spinning Top — Candlestick lines that have small bodies with upper and lower shadows that exceed the length of the body. Spinning tops signal indecision.

Shooting Star — A single day pattern that can appear in an uptrend. It opens higher, trades much higher, then closes near its open. It looks just like the Inverted Hammer except that it is bearish.

Rising Three Methods — A bullish continuation pattern in which a long white body is followed by three small body days, each fully contained within the range of the high and low of the first day. The fifth day closes at a new high.

Piercing Line — A bullish two-day reversal pattern. The first day, in a downtrend, is a long black day. The next day opens at a new low, then closes above the midpoint of the body of the first day.

Morning Star — A three-day bullish reversal pattern consisting of three candlesticks - a long-bodied black candle extending the current downtrend, a short middle candle that gapped down on the open, and a long-bodied white candle that gapped up on the open and closed above the midpoint of the body of the first day.

Morning Doji Star — A three-day bullish reversal pattern that is very similar to the Morning Star. The first day is in a downtrend with a long black body. The next day opens lower with a Doji that has a small trading range. The last day closes above the midpoint of the first day.

Marubozu — A candlestick with no shadow extending from the body at either the open, the close or at both. The name means close-cropped or close-cut in Japanese, though other interpretations refer to it as Bald or Shaven Head.

Matching Low — This pattern occurs when two black days appear with equal closes in a downtrend. Matching Low indicates a bottom has been made, even though the new low was tested and there was no follow through, which is indicative of a good support price.

Long Shadows — Candlesticks with a long upper shadow and short lower shadow indicate that buyers dominated during the first part of the session, bidding prices higher. Conversely, candlesticks with long lower shadows and short upper shadows indicate that sellers dominated during the first part of the session, driving prices lower.

Long-Legged Doji — This candlestick has long upper and lower shadows with the Doji in the middle of the day's trading range, clearly reflecting the indecision of traders.

Long Body — A long day represents a large price move from open to close, where the length of the candle body is long.

Ladder Bottom — This is a five candlestick pattern that starts with three strong black candlesticks. The downtrend continues with the fourth lower close. The next day gaps higher and closes much higher than the previous day or two. This may imply a bullish reversal.

Inverted Hammer — A one-day bullish reversal pattern. In a downtrend, the open is lower, then it trades higher, but closes near its open, therefore looking like an inverted lollipop.

Harami Cross — A two-day pattern similar to the Harami. The difference is that the last day is a Doji.

Harami — A two-day pattern that has a small body day completely contained within the range of the previous body, and is the opposite color.

Hanging Man — The pattern occurs at the top of a trend or during an uptrend. The name Hanging Man comes from the fact that the candlestick looks somewhat like a hanging man. It is a single candlestick pattern that has a long lower shadow and a small body at or very near the top of its daily trading range.

Hammer — This pattern occurs at the bottom of a trend or during a downtrend and it is called a Hammer since it is hammering out of a bottom. It is a single candlestick pattern that has a long lower shadow and a small body at or very near the top of its daily trading range.
Homing Pigeon — This pattern is a small black body contained by a prior relatively long black body. It resembles the Harami pattern, except that both bodies are black.

Kicking — This pattern consists firstly of a black Marubozu and then a white Marubozu. After the black Marubozu, the market opens above the prior session’s opening, forming a gap between the two candlesticks.

Gravestone Doji — A doji line that develops when the Doji is at, or very near, the low of the day.

Falling Three Methods — A bearish continuation pattern. A long black body is followed by three small body days, each fully contained within the range of the high and low of the first day. The fifth day closes at a new low.

Falling Window Pattern — The same as a Western gap. Windows are continuation candlestick patterns. If a window opens in a selloff, it is a falling window. This is a bearish signal. The falling window is resistance.

Frying Pan Bottom Pattern — The fry pan bottom occurs when small real body candlesticks slowly move downward and then move in a neutral to upward direction. The fry pan bottom pattern is complete when a bullish candlestick gaps up from the rest of the candlesticks.

Four Price Doji — This candlestick is simply a horizontal line that has no upper and lower shadows.
https://investorshub.advfn.com/uimage/uploads/2018/1/15/cfzwjFour_Price_Doji.jpg
Evening Star — This is a three-candlestick pattern signaling a major top reversal. It is composed of a white candlestick followed by a short candlestick, which characteristically gaps up to form a star. Then we have a third black candlestick whose closing is well into the first session’s white body. This is a meaningful top pattern.

Evening Doji Star — A three-day bearish reversal pattern similar to the Evening Star. The uptrend continues with a large white body. The next day opens higher, trades in a small range, then closes at its open (Doji). The next day closes below the midpoint of the body of the first day.

Engulfing Pattern — A reversal pattern that can be bearish or bullish, depending upon whether it appears at the end of an uptrend (bearish engulfing pattern) or a downtrend (bullish engulfing pattern). The first day is characterized by a small body, followed by a day whose body completely engulfs the previous day's body and closes in the opposite direction of the trend. This pattern is similar to the outside reversal chart pattern, but does not require the entire range (high and low) to be engulfed, just the open and close.

Dragonfly Doji — A Doji where the open and close price are at the high of the day. Like other Doji days, this one normally appears at market turning points.

Downside Tasuki Gap — A continuation pattern with a long, black body followed by another black body that has gapped below the first one. The third day is white and opens within the body of the second day, then closes in the gap between the first two days, but does not close the gap.

Doji — Doji form when a security's open and close are virtually equal. The length of the upper and lower shadows can vary, and the resulting candlestick looks like, either, a cross, inverted cross, or plus sign. Doji convey a sense of indecision or tug-of-war between buyers and sellers. Prices move above and below the opening level during the session, but close at or near the opening level.

Dark Cloud Cover — A bearish reversal pattern that continues the uptrend with a long white body. The next day opens at a new high then closes below the midpoint of the body of the first day.

Concealing Baby Swallow — This is a pattern formed by four black candlesticks. After two falling Black Marubozu days, a short down day engulfed by a fourth black day shows that the downtrend has eroded significantly, despite the final close is at a new low.

Breakaway — This five candlestick pattern starts with a strong black candlestick. The next three days after the downside gap set consecutively lower prices. However, the last day completely erases the limited losses of down days and closes inside the gap between the first and second days. This suggests a short term reversal.

Bullish Side-by-Side White Lines — Two consecutive white candlesticks that have the same open and whose real bodies are about the same size. In an uptrend, if these side-by-side white lines gap higher, it is a bullish continuation candlestick pattern. In a downtrend, on Japanese candlestick charts these side-by-side white lines are still considered bearish (in spite of their white candles since they come after a falling gap).

Bearish On Neck Pattern — The on neck pattern occurs when a long bearish candle is followed by a short bullish candle that fails to close above the prior candle’s close and represents a bearish continuation pattern.

Belt Hold — Bullish Belt Hold is a single candlestick pattern, basically, a White Opening Marubozu that occurs in a downtrend. It opens on the low of the day, and then a rally begins during the day against the overall trend of the market, which eventually stops with a close near the high, leaving a small shadow on top of the candle. If longer bodies characterize the Belt Hold, then the resistance they offer against the trend will be even much stronger.

Abandoned Baby — A rare reversal pattern characterized by a gap followed by a Doji, which is then followed by another gap in the opposite direction. The shadows on the Doji must completely gap below or above the shadows of the first and third day.

Chart Patterns
Double Top Reversal — The Double Top Reversal is a bearish reversal pattern typically found on bar charts, line charts, and candlestick charts. As its name implies, the pattern is made up of two consecutive peaks that are roughly equal, with a moderate trough in-between.

Double Bottom Reversal — The Double Bottom Reversal is a bullish reversal pattern typically found on bar charts, line charts, and candlestick charts. As its name implies, the pattern is made up of two consecutive troughs that are roughly equal, with a moderate peak in-between.

Head and Shoulders Top — A Head and Shoulders reversal pattern forms after an uptrend, and its completion marks a trend reversal. The pattern contains three successive peaks with the middle peak (head) being the highest and the two outside peaks (shoulders) being low and roughly equal. The reaction lows of each peak can be connected to form support, or a neckline.

Head and Shoulders Bottom — The Head and Shoulders Bottom, sometimes referred to as an Inverse Head and Shoulders, is a pattern that shares many common characteristics with its comparable partner, but relies more heavily on volume patterns for confirmation.
As a major reversal pattern, the Head and Shoulders Bottom forms after a downtrend, and its completion marks a change in trend. The pattern contains three successive troughs with the middle trough (head) being the deepest and the two outside troughs (shoulders) being shallower. Ideally, the two shoulders would be equal in height and width. The reaction highs in the middle of the pattern can be connected to form resistance, or a neckline.


Discover What Traders Are Watching
Explore small cap ideas before they hit the headlines.


