


| Followers | 679 |
| Posts | 141062 |
| Boards Moderated | 36 |
| Alias Born | 03/10/2004 |
Thursday, January 11, 2018 4:37:09 PM
By: Clive Maund | January 11, 2018
When you are following the markets closely day after day it can be easy to lose sight of the big picture. So with the “everything bubble” getting closer to bursting, leading to universal mess and mayhem, there could not be a better time to look at the long-term picture for gold and silver, in order to see whether they are going to salute and go down with the ship, like they did in 2008, or constitute a lifeboat and a profitable means of escape for more fortunate investors.
I am therefore pleased to be able to report that it will almost certainly be the latter, for reasons that we will now elucidate on the respective long-term charts for gold then silver.
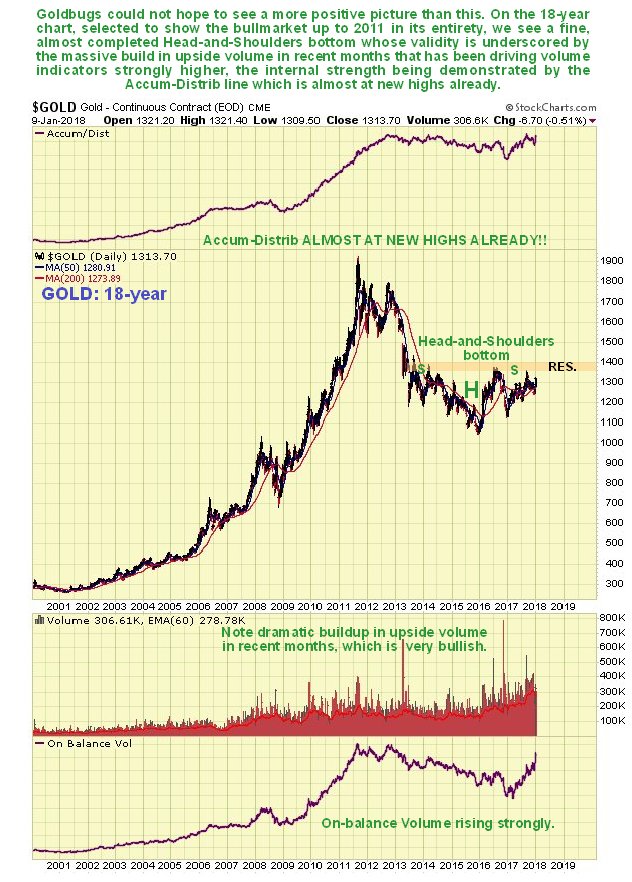
On gold’s latest 18-year chart – a time period selected to show the prior 2000’s bullmarket in its entirety, we can readily see that a potential Head-and-Shoulders bottom has been forming since 2013, and the probability that this is the genuine article, the “real deal” is vastly improved by the dramatic increase in upside volume over the past 2 years as this base pattern has approached completion, which has driven volume indicators strongly higher over the past year, such that, rather incredibly, the Accum-Distrib line is already close to making new highs, which is a very bullish indication indeed.
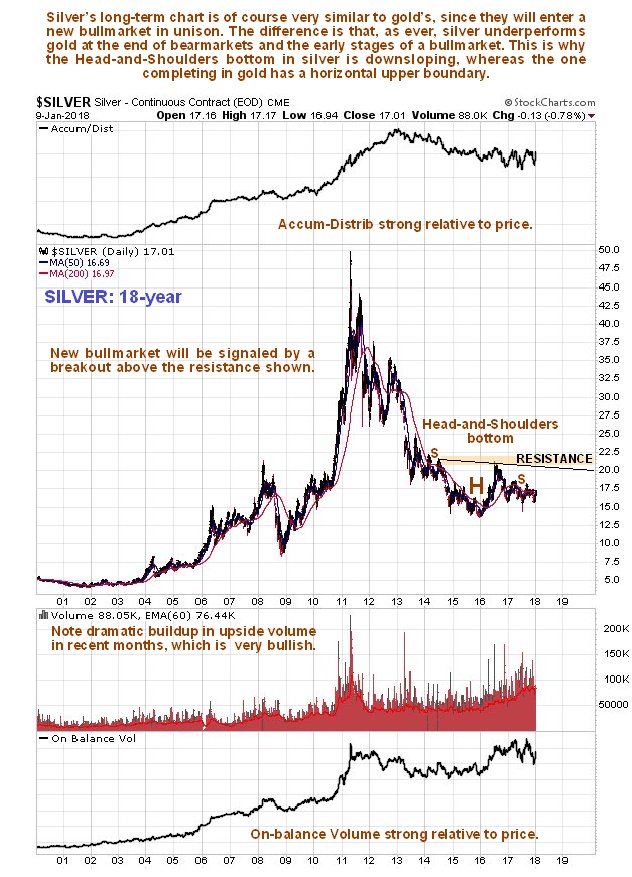
It’s pretty much the same story for silver, with two key differences – silver’s Head-and-Shoulders bottom is downsloping and the volume indicators are not quite as strong. However, these manifestations are not negative, for it is normal for silver to underperform gold towards the end of a sector bearmarket and during the early stages of a bullmarket.
Are there any Precious Metals stocks showing similar bottoming patterns? There certainly are – loads of them, and we will have a look at two examples here, one for a larger gold stock and one for a larger silver stock, to illustrate the point, so that you will understand that this is not just an academic exercise – and that you are currently being showered in opportunities to make big money in this sector.
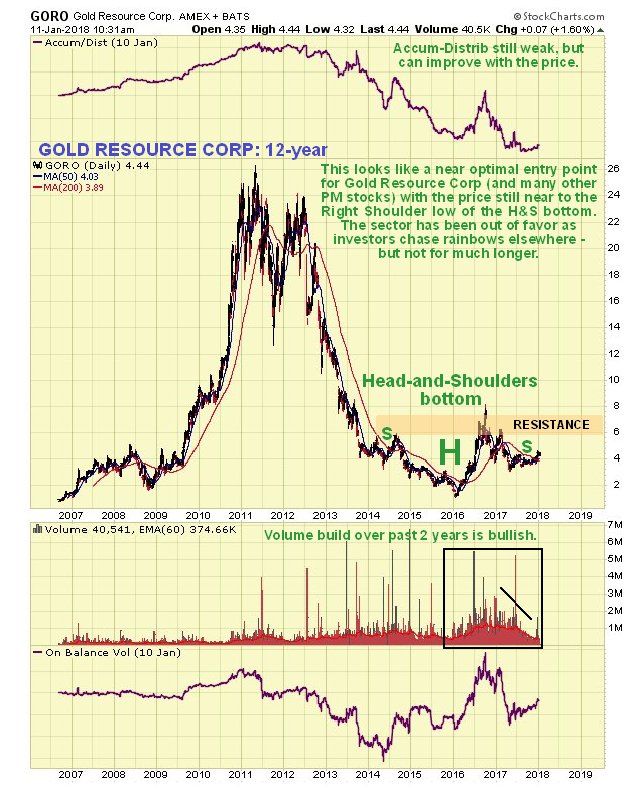
The long-term chart for Gold Resource Corp shows that it is completing a giant Head-and-Shoulders bottom that parallels the one in gold itself, and since the price is still quite close to the low of the Right Shoulder low of the pattern, it is at a good entry point.
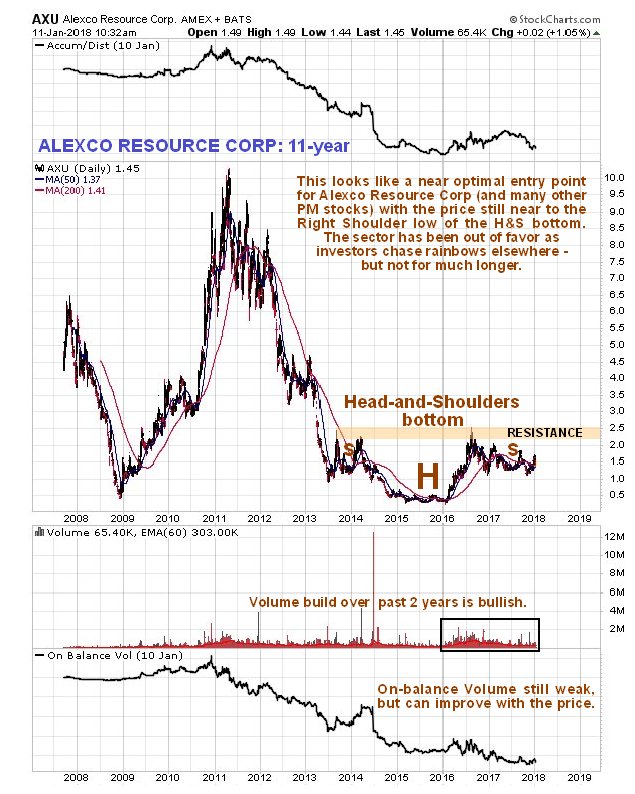
The long-term chart for Alexco Resource Corp shows that it is completing a fine giant Head-and-Shoulders bottom that parallels the one in silver itself, although it is not downsloping, and since the price is also still quite close to the low of the Right Shoulder low of the pattern, it too is at a good entry point.
Gold and silver have not done well in recent years, having been completely overshadowed by the broad stockmarket and more glamorous sectors like Biotech, Cannabis, Cryptocurrencies and the FANGS etc. If they go roaring up, then it means that something else is going to have to go down, and that probably means most everything else in a market crash, which is already being predicated by action in the bondmarket and other factors, and all the easy money momentum chasers who are now almost everywhere are going to wind up being slaughtered en masse like Pilot Whales on a Faroes beach. We are not going to let that happen to us.
Note that additions and improvements may be made to this article later.
https://www.clivemaund.com/free.php?id=4487
• DiscoverGold
Information posted to this board is not meant to suggest any specific action, but to point out the technical signs that can help our readers make their own specific decisions. Your Due Dilegence is a must!
• DiscoverGold
Recent GDX News
- YieldMax GDXY Name Change • GlobeNewswire Inc. • 01/25/2024 04:22:00 PM
- Surging S&P 500 Breadth • ValueWalk • 07/19/2023 03:16:37 PM
- S&P 500 Corrects In Breadth • ValueWalk • 07/18/2023 03:08:49 PM
- If The USDX Fell So Much, Why Didn’t Gold Truly Soar? • ValueWalk • 07/17/2023 05:16:20 PM
- USD’s Decline That’s… Bearish For Gold?! • ValueWalk • 07/12/2023 02:38:08 PM
- S&P 500 Late Day Reversal Worry • ValueWalk • 07/10/2023 03:17:34 PM
- Massive Gaming Celebrates Global Launch of House of Blackjack with USDC Earning Race • ValueWalk • 07/10/2023 02:44:17 PM
- Breathers In Mining Stocks Are Not Real Rallies • ValueWalk • 07/06/2023 05:20:55 PM
- S&P 500 Character Changes • ValueWalk • 07/06/2023 03:10:06 PM
- S&P 500 – As Bullish As It Gets • ValueWalk • 07/03/2023 04:01:21 PM
- The Great Gold Migration: How Asia Is Dominating The Global Gold Landscape • ValueWalk • 06/30/2023 05:07:35 PM
- S&P 500 Dip Buying And Tame PCE • ValueWalk • 06/30/2023 03:34:13 PM
- The Bullish Reversal In Gold Is Coming • ValueWalk • 06/29/2023 04:00:44 PM
- Insufficient S&P 500 Rotations • ValueWalk • 06/27/2023 02:41:42 PM
- Failing S&P 500 Rotations • ValueWalk • 06/23/2023 03:09:19 PM
- Countdown to S&P 500 Downleg • ValueWalk • 06/19/2023 01:49:20 PM
- Now THAT Was The Game-Changer For The Price Of Gold! • ValueWalk • 06/15/2023 04:40:35 PM
- S&P 500 Manages To Recover Initial Decline • ValueWalk • 06/15/2023 03:30:07 PM
- S&P 500 Manages To Recover From Tech-Driven Decline • ValueWalk • 06/15/2023 03:30:07 PM
- S&P 500 Withstands The Initial Selling – No Hike Tomorrow • ValueWalk • 06/13/2023 03:15:19 PM
- Roadmap For Mining Stocks – Courtesy Of The Stock Market • ValueWalk • 06/06/2023 03:17:49 PM
- Stocks To Still Extend S&P 500 Upswing • ValueWalk • 06/05/2023 03:31:02 PM
- AI, Stocks, And Gold Stocks – Connected After All • ValueWalk • 05/31/2023 03:29:15 PM
- Could Gold Miners Finally Stop Sliding?! • ValueWalk • 05/26/2023 08:42:37 PM
- S&P 500 Fine Selling Initiative • ValueWalk • 05/24/2023 03:06:00 PM
NanoViricides Reports that the Phase I NV-387 Clinical Trial is Completed Successfully and Data Lock is Expected Soon • NNVC • May 2, 2024 10:07 AM
ILUS Files Form 10-K and Provides Shareholder Update • ILUS • May 2, 2024 8:52 AM
Avant Technologies Names New CEO Following Acquisition of Healthcare Technology and Data Integration Firm • AVAI • May 2, 2024 8:00 AM
Bantec Engaged in a Letter of Intent to Acquire a Small New Jersey Based Manufacturing Company • BANT • May 1, 2024 10:00 AM
Cannabix Technologies to Deliver Breath Logix Alcohol Screening Device to Australia • BLO • Apr 30, 2024 8:53 AM
Hydromer, Inc. Reports Preliminary Unaudited Financial Results for First Quarter 2024 • HYDI • Apr 29, 2024 9:10 AM

