The Japanese have been using candlestick charts since the 17th century to analyze rice prices. Candlesticks were introduced into modern technical analysis by Steve Nison in his book Japanese Candlestick Charting Techniques.
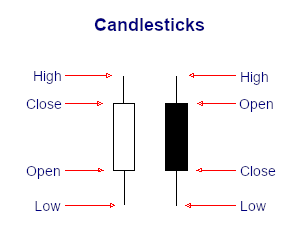
Candlesticks contain the same data as a normal bar chart but highlight the relationship between opening and closing prices. The narrow stick represents the range of prices traded during the period (high to low) while the broad mid-section represents the opening and closing prices for the period.
If the close is higher than the open - the candlestick mid-section is hollow or shaded blue/green. If the open is higher than the close - the candlestick mid-section is filled in or shaded red.
The advantage of candlestick charts is the ability to highlight trend weakness and reversal signals that may not be apparent on a normal bar chart.
Register for free to join our community of investors and share your ideas. You will also get access to streaming quotes, interactive charts, trades, portfolio, live options flow and more tools.


 News
News  Market Data
  Discover