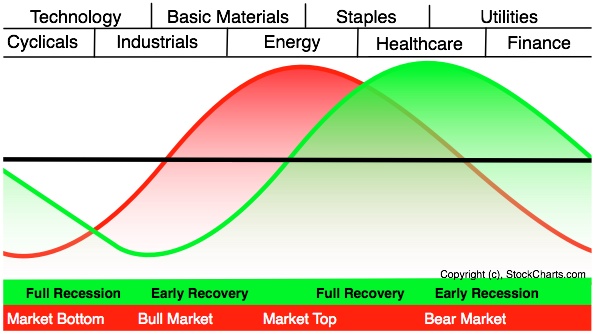
Unsurprisingly, the business cycle influences the rotation of stock market sectors and industry groups. Certain sectors perform better than others during specific phases of the business cycle. Knowing the stage of the business cycle can help investors position themselves in the right sectors and avoid the wrong sectors.
The graph above shows the economic cycle in green, the stock market cycle in red and the best performing sectors at the top. The green economic cycle corresponds to the business cycle shown above. The centerline marks the contraction/expansion threshold for the economy. Notice how the red market cycle leads the business cycle. The market turns up and crosses the centerline before the economic cycle turns. Similarly, the market turns down and crosses below the centerline ahead of the economic cycle.
Cyclicals, which is the same as the consumer discretionary sector, are the first to turn up in anticipation of a bottom in the economy. Technology stocks are not far behind. These two groups are the big leaders at the beginning of a bull run in the stock market.
The top of the market cycle is marked by relative strength in materials and energy. These sectors benefit from a rise in commodity prices and a rise in demand from an expanding economy. The tipping point for the market comes when leadership shifts from energy to consumer staples. This is a sign that commodity prices are starting to hurt the economy.
The market peak and downturn are followed by a contraction in the economy. At this stage, the Fed starts to lower interest rates and the yield curve steepens. Falling interest rates benefit debt-laden utilities and business at banks. The steepening yield curve also improves profitability at banks and encourages lending. Low interest rates and easy money eventually lead to a market bottom and the cycle repeats itself.
The two sector PerfCharts below show relative performance for the nine sector SPDRs near the 2007 peak and after the 2003 bottom. The S
Register for free to join our community of investors and share your ideas. You will also get access to streaming quotes, interactive charts, trades, portfolio, live options flow and more tools.


 News
News  Market Data
  Discover