Equal-Weight ETFs Log New ITTM BUY Signals By: Erin Heim | September 20, 2017
DecisionPoint tracks not only the sector SPDRS, but we also follow the equal-weight versions. For more information about the benefits of trading equal-weight ETFs, you can read this article written by Carl. Today is a teachable moment with these three IT Trend Model BUY signals arriving on the same day. The lesson? Not all BUY signals are good BUY signals, some may be "good-bye" signals.
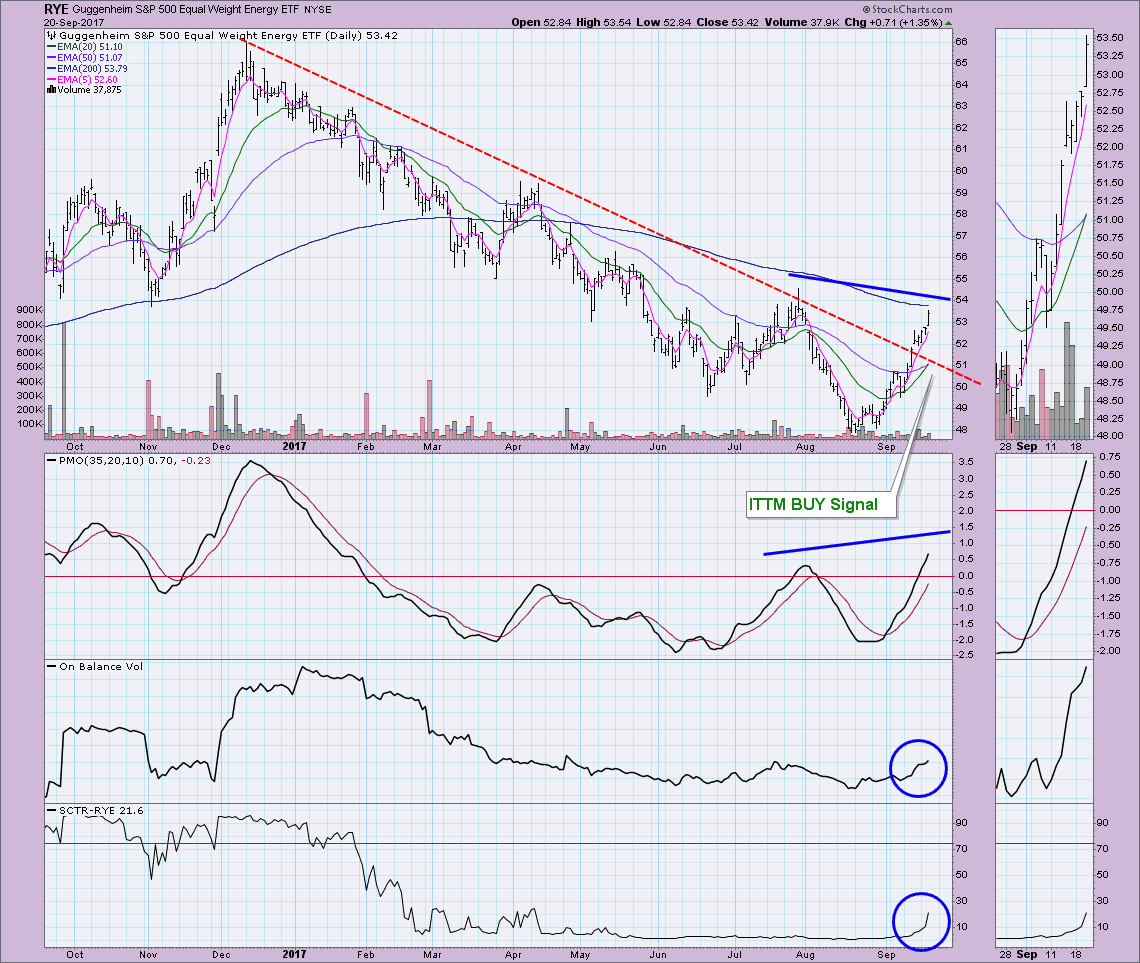
I'm going to start with the equal-weight Energy ETF (RYE). It shouldn't surprise anyone who follows the DecisionPoint blog (or MarketWatchers LIVE program) that the equal-weight version of the Energy SPDR (XLE) logged a new BUY signal. Energy has been on fire. One thing to keep in mind with trading equal-weight vehicles, they tend to do better on the rallies than the SPDRs. However, when they take a hit or decline, it can be deeper than the SPDR. I love this chart (as I love nearly all of the energy sector right now). We finally saw a breakout from the long-term declining tops trendline. Price is getting ready to test the previous high from July and by the looks of this chart, it should easily reach and likely exceed that high in the coming week. You can see the ITTM BUY signal quite clearly as the 20-EMA crossed above the 50-EMA. I can already see either a positive divergence or bullish confirmation shaping up between the PMO tops and price tops. The SCTR is coming back to life and the OBV is clearly behind this rally.
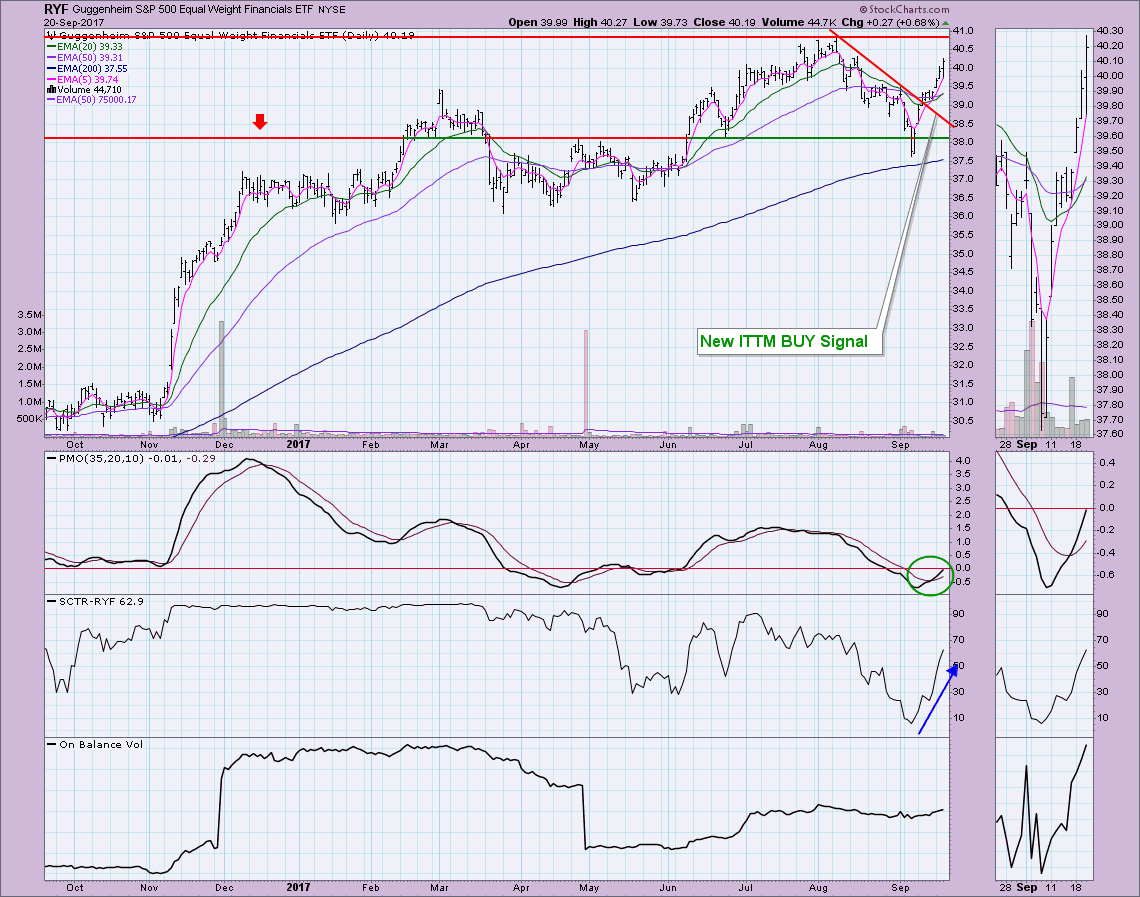
I wrote about the Financial SPDR (XLF) logging a new IT Trend Model BUY signal on Monday and now we see the equal-weight Financial ETF (RYF) logging the same. The financial sector has been rallying and we can see in the thumbnail a nice flag formation that triggered on Monday. Based on the minimum upside target for that flag, we should see overhead resistance broken and new all-time highs registered. All of the indicators look great. I especially like seeing the PMO BUY signal arriving in oversold territory.
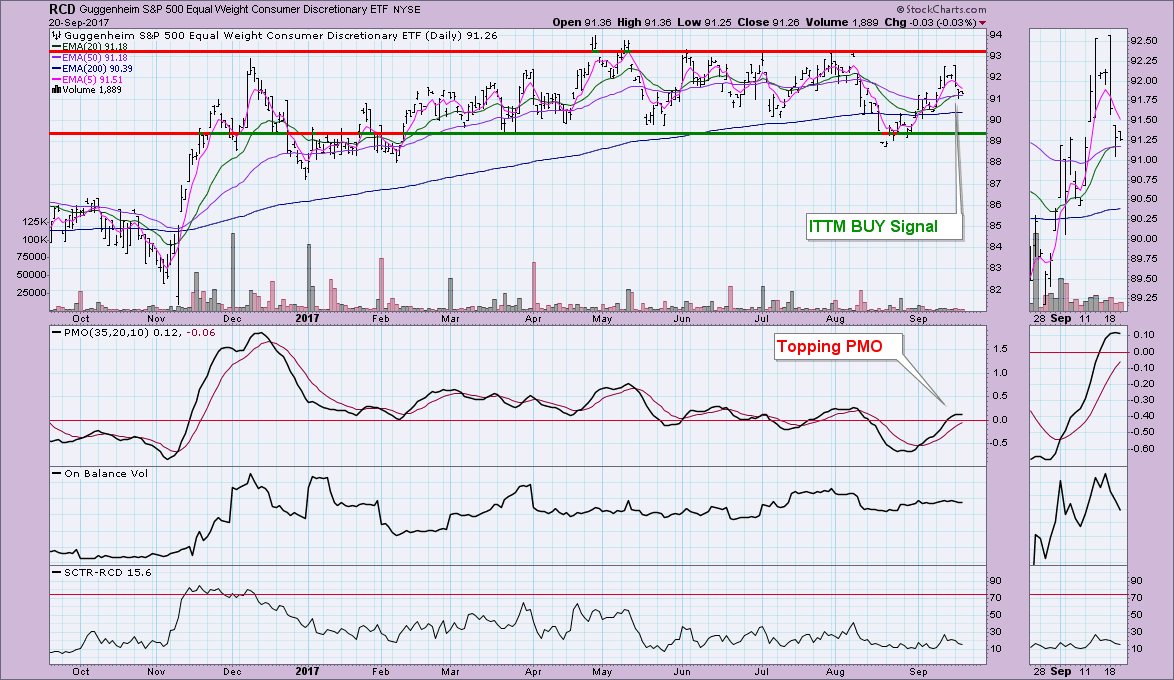
The last ITTM BUY signal to arrive was on the equal-weight Consumer Discretionary ETF (RCD). The 20-EMA barely crossed above the 50-EMA to trigger this signal. You can see the 5-EMA is already moving toward a negative crossover of the 20-EMA which would trigger a STTM Neutral signal. The ITTM BUY signal won't likely last through tomorrow unless we see a rally that keeps price above the 50-EMA. The margin between these two EMAs is less that .01 which leaves the signal vulnerable to whipsaw. Looking at the topping PMO and declining SCTR, I suspect this is a head fake BUY signal. On the bright side, a pullback or corrective move to support would offer an excellent opportunity to get in. The trading channel has been intact since February.
Conclusion: Not all BUY signals are equal. Today's BUY signal on RCD isn't likely a "good" one. I would expect to see it negated within the week.
Technical Analysis is a windsock, not a crystal ball.
Information posted to this board is not meant to suggest any specific action, but to point out the technical signs that can help our readers make their own specific decisions. Your Due Dilegence is a must! • DiscoverGold
Register for free to join our community of investors and share your ideas. You will also get access to streaming quotes, interactive charts, trades, portfolio, live options flow and more tools.


 News
News  Market Data
  Discover