


| Followers | 689 |
| Posts | 143817 |
| Boards Moderated | 35 |
| Alias Born | 03/10/2004 |
Monday, August 14, 2017 11:24:16 AM
:::: S&P500 Turbulence - What's all the fuss about?
By Steve Deppe | August 13, 2017
Imagine yourself on a five-hour flight across the country. The flight's been smooth sailing for a few hours and then suddenly you hear the crew announce:
"Ladies and gentlemen, the Captain has turned on the fasten seat belt sign. We are anticipating a bit of turbulence. Please return to your seats and keep your seat belts fastened. Thank you.”
We've all heard it before, and even the most fearful of fliers tend to find some comfort during the turbulence based on the warning they were provided before the turbulence.
This is exactly how I feel about the state of the markets at the present moment. There was a mountain of identifiable evidence during the month of July that suggested the S&P500 would experience turbulence during the month of August. I shared my thoughts here on 7/14, Michael Santoli (one of the few bright spots on CNBC) shared his thoughts here on 7/24. Meanwhile, sentiment seamed to get incredibly lopsided with some truly head scratching bullish quotes from the likes of Jim Paulsen and Josh Brown. Paulsen stated here that "the Bull Market could continue forever", which is laughable, while Josh Brown gave us this gem here where he all but mocked the bears by sharing the view through the rear view mirror, while admitting he has no visibility through the windshield - thanks "Captain Obvious". I certainly have no visibility through the windshield either, but i'm not going to mock the bears based on nothing but hindsight bias. This cyclical "Bull Market" is barely a year old (remember, we were mostly range bound from summer 2014 to summer 2016), there was nothing even remotely obvious about its existence until July 2016, and the rally off the 200 day simple moving average that began on November 7th - and continued following a shock election result - was far from obvious too. Sorry, Josh.
Back to the point, I don't think there's anything to fuss about at the present moment, at least not yet. Last weeks pullback is normal, healthy, and refreshing. Now, just like pilots have absolutely no way to predict the full intensity or duration of turbulence, I have no way of predicting the intensity or duration of this pullback. When turbulence lasts for longer than you'd like, or gets a bit more bumpy than you'd like, you soon forget about the crew's warning and begin to wonder "when is this going to end?" or "are we going to crash?". The same can be said for markets, the longer we see red on the screen, the further we head to the south, it's only natural to then wonder "are we going to crash?". As a student of history I understand a crash is always possible, but I also understand it's not the most probable outcome. The more probable outcome is that we bend but don't break, and then find our way back to the upside via the inevitable "oversold" bounce. Since 1970, there's 132 calendar months that closed at an all-time high - and there's only 7 instances of "Bearish Outside Reversal Months" the very next month. This leaves wiggle room to perhaps trade down toward the ascending 100 day simple moving average at 2,411 before reversing course to the upside. In the scenario where we do trade below July and June's monthly low, then I think we'll have something to fuss about. A "Bearish Outside Reversal Month" following an all-time high monthly close reeks of distribution - and distribution is never a good thing.
Last week provided quite a few rare occurrences that we can quantify to attempt to identify a historical tendency for the SPDR S&P500 ETF (SPY). Here's a few that caught my eye:
The Volatility Index (VIX) exploded 54.64% last week with Friday's close at 15.51. This is the 7th largest weekly increase for the VIX dating back to 1990.
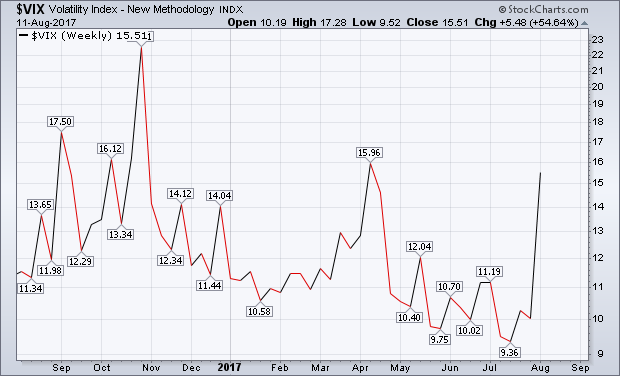
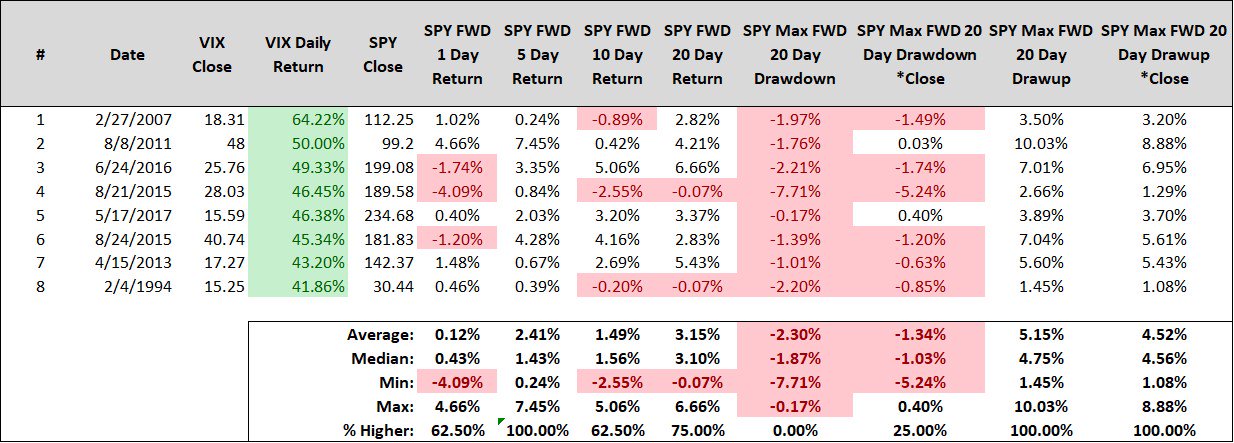
Much of the weekly advance was attributable to Thursday's upside explosion. The VIX gained 44.37% on Thursday alone, marking just the 9th trading day where the VIX gained 40% or more since SPY inception. Following trading days where VIX gained 40% or more, SPY's forward 5 day returns are higher in all 8 prior samples for median returns of 1.43%. Additionally, SPY's forward 20 day returns are higher 6 of 8 for median returns of 3.10%, but the two losers are declines of just -0.07% (although one came with a -7.71% drawdown prior to day 20, ouch).
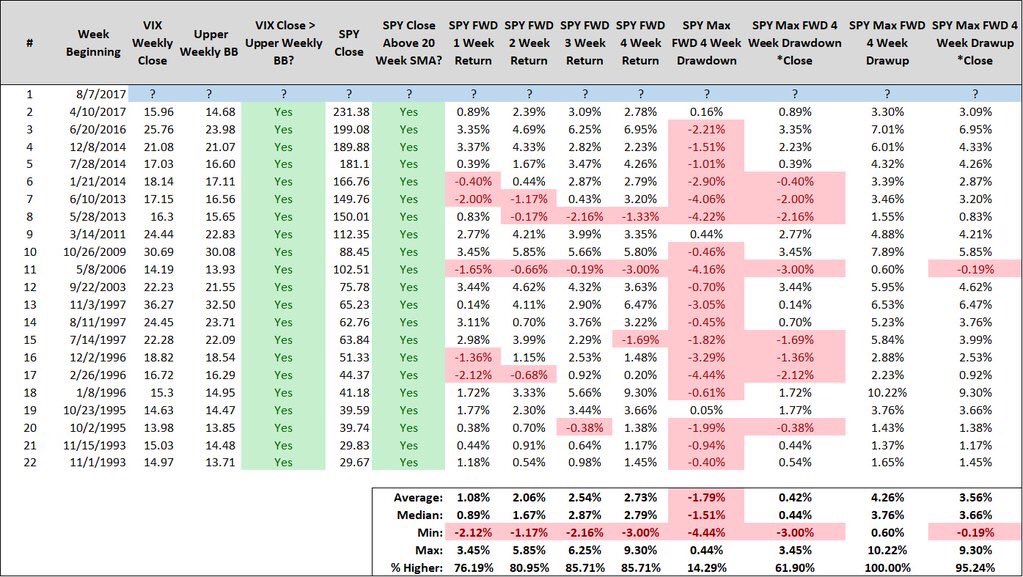
The VIX also closed last Friday above its upper weekly Bollinger Band. When this occurs during an uptrend for SPY, as defined by SPY closing the same trading week above its 20 week simple moving average, this is historically a very bullish sign over the forward 4 weeks. This has occurred 21 times since SPY inception, and 17 of 21 samples are higher two weeks later, while 18 of 21 samples are higher three and four weeks later. Median returns over the forward 2, 3, and 4 weeks are 1.67%, 2.87%, and 2.79%. Additionally, 13 of 21 samples marked the lowest forward 4 week close for SPY. In other words, history says there's a 61.90% chance that last Friday's close was the lowest weekly close over the coming four weeks.
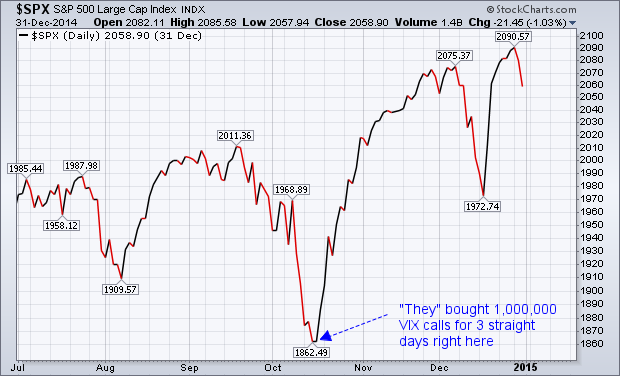
Sentiment wise, there's evidence to suggest that participants are preparing for Armageddon. There's been 4,880,325 VIX call option contracts purchased the last three trading days, more than 1,000,000 VIX calls bought each of the last three trading sessions. "They" even bought 1,720,153 on Friday, after the VIX exploded 44.37% on Thursday. Three consecutive trading sessions with participants purchasing seven figures of VIX call option contracts has occurred exactly one other time since February 2006, and that was 10/16/2014. The chart below illustrates what followed rather clearly.
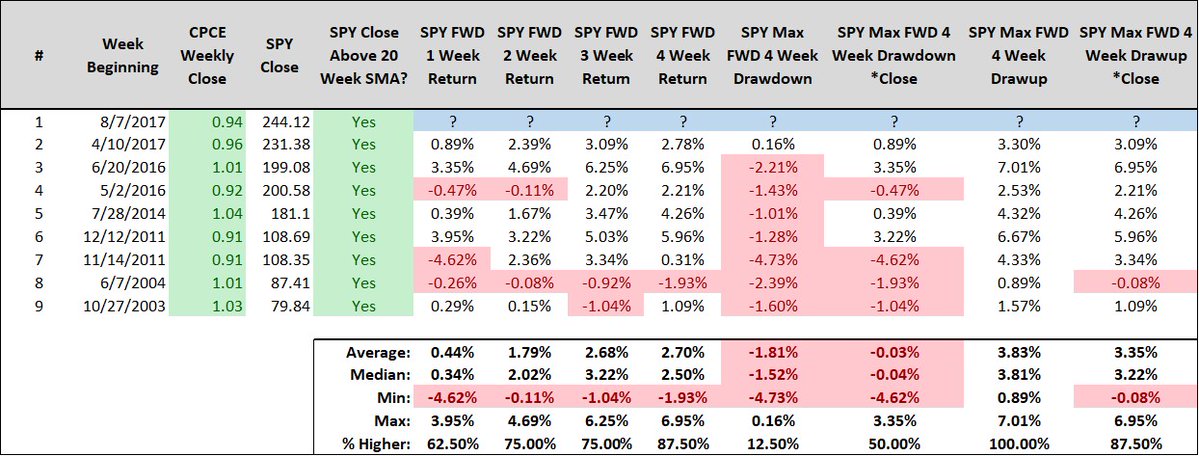
The CBOE Equity Only Put/Call Ratio (CPCE) closed last week at 0.94. Eyeballing the chart, a weekly close above 0.90 is fairly uncommon.
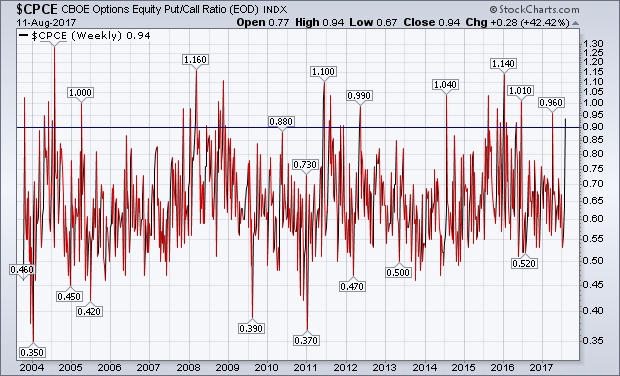
It would seem participants didn't want to head into the weekend without protection. When CPCE closes the week at or above 0.90 during an uptrend for SPY, as defined by SPY closing the same trading week above its 20 week simple moving average, this has also been a very bullish sign for SPY over the forward 4 weeks. Since 2003, this has happened 8 times and SPY's forward 2 week returns are higher 6 of 8 for median returns of 2.02%. However, the 2 decliners over the forward 2 weeks are losses of just -0.11% and -0.08%, barely a scratch. SPY's forward 4 week returns are higher 7 of 8 samples for median returns of 2.50%.
In summary, I don't think there's anything to fuss about. Now, if the S&P500 goes against these historical tendencies, and doesn't plant its foot in the ground and turn on a dime to the north at some point over the coming week or two, i'll start to get a bit uncomfortable, especially if we trade below July's low at 2,407. Then we'll have something to fuss about. We do live in unprecedented times, so unprecedented price action is always a possibility, especially if we get unprecedented "fire and fury" between the United States and North Korea. But until then, it's far more likely that these fears are overblown, and I believe we bend but don't break. The bears are notorious for turnovers in their opponents territory, I think the bulls have a good shot of picking one off and taking it back in the other direction. Can you tell I'm ready for the football season to start?
https://steve-deppe.squarespace.com/blog/2017/8/10/sp500-turbulence-whats-the-fuss-about
• DiscoverGold
Click on "In reply to", for Authors past commentaries
*** For Market Direction and Trends visit our board:
https://investorshub.advfn.com/Market-Direction-and-Trends-26249/
By Steve Deppe | August 13, 2017
Imagine yourself on a five-hour flight across the country. The flight's been smooth sailing for a few hours and then suddenly you hear the crew announce:
"Ladies and gentlemen, the Captain has turned on the fasten seat belt sign. We are anticipating a bit of turbulence. Please return to your seats and keep your seat belts fastened. Thank you.”
We've all heard it before, and even the most fearful of fliers tend to find some comfort during the turbulence based on the warning they were provided before the turbulence.
This is exactly how I feel about the state of the markets at the present moment. There was a mountain of identifiable evidence during the month of July that suggested the S&P500 would experience turbulence during the month of August. I shared my thoughts here on 7/14, Michael Santoli (one of the few bright spots on CNBC) shared his thoughts here on 7/24. Meanwhile, sentiment seamed to get incredibly lopsided with some truly head scratching bullish quotes from the likes of Jim Paulsen and Josh Brown. Paulsen stated here that "the Bull Market could continue forever", which is laughable, while Josh Brown gave us this gem here where he all but mocked the bears by sharing the view through the rear view mirror, while admitting he has no visibility through the windshield - thanks "Captain Obvious". I certainly have no visibility through the windshield either, but i'm not going to mock the bears based on nothing but hindsight bias. This cyclical "Bull Market" is barely a year old (remember, we were mostly range bound from summer 2014 to summer 2016), there was nothing even remotely obvious about its existence until July 2016, and the rally off the 200 day simple moving average that began on November 7th - and continued following a shock election result - was far from obvious too. Sorry, Josh.
Back to the point, I don't think there's anything to fuss about at the present moment, at least not yet. Last weeks pullback is normal, healthy, and refreshing. Now, just like pilots have absolutely no way to predict the full intensity or duration of turbulence, I have no way of predicting the intensity or duration of this pullback. When turbulence lasts for longer than you'd like, or gets a bit more bumpy than you'd like, you soon forget about the crew's warning and begin to wonder "when is this going to end?" or "are we going to crash?". The same can be said for markets, the longer we see red on the screen, the further we head to the south, it's only natural to then wonder "are we going to crash?". As a student of history I understand a crash is always possible, but I also understand it's not the most probable outcome. The more probable outcome is that we bend but don't break, and then find our way back to the upside via the inevitable "oversold" bounce. Since 1970, there's 132 calendar months that closed at an all-time high - and there's only 7 instances of "Bearish Outside Reversal Months" the very next month. This leaves wiggle room to perhaps trade down toward the ascending 100 day simple moving average at 2,411 before reversing course to the upside. In the scenario where we do trade below July and June's monthly low, then I think we'll have something to fuss about. A "Bearish Outside Reversal Month" following an all-time high monthly close reeks of distribution - and distribution is never a good thing.
Last week provided quite a few rare occurrences that we can quantify to attempt to identify a historical tendency for the SPDR S&P500 ETF (SPY). Here's a few that caught my eye:
The Volatility Index (VIX) exploded 54.64% last week with Friday's close at 15.51. This is the 7th largest weekly increase for the VIX dating back to 1990.

Much of the weekly advance was attributable to Thursday's upside explosion. The VIX gained 44.37% on Thursday alone, marking just the 9th trading day where the VIX gained 40% or more since SPY inception. Following trading days where VIX gained 40% or more, SPY's forward 5 day returns are higher in all 8 prior samples for median returns of 1.43%. Additionally, SPY's forward 20 day returns are higher 6 of 8 for median returns of 3.10%, but the two losers are declines of just -0.07% (although one came with a -7.71% drawdown prior to day 20, ouch).

The VIX also closed last Friday above its upper weekly Bollinger Band. When this occurs during an uptrend for SPY, as defined by SPY closing the same trading week above its 20 week simple moving average, this is historically a very bullish sign over the forward 4 weeks. This has occurred 21 times since SPY inception, and 17 of 21 samples are higher two weeks later, while 18 of 21 samples are higher three and four weeks later. Median returns over the forward 2, 3, and 4 weeks are 1.67%, 2.87%, and 2.79%. Additionally, 13 of 21 samples marked the lowest forward 4 week close for SPY. In other words, history says there's a 61.90% chance that last Friday's close was the lowest weekly close over the coming four weeks.

Sentiment wise, there's evidence to suggest that participants are preparing for Armageddon. There's been 4,880,325 VIX call option contracts purchased the last three trading days, more than 1,000,000 VIX calls bought each of the last three trading sessions. "They" even bought 1,720,153 on Friday, after the VIX exploded 44.37% on Thursday. Three consecutive trading sessions with participants purchasing seven figures of VIX call option contracts has occurred exactly one other time since February 2006, and that was 10/16/2014. The chart below illustrates what followed rather clearly.

The CBOE Equity Only Put/Call Ratio (CPCE) closed last week at 0.94. Eyeballing the chart, a weekly close above 0.90 is fairly uncommon.

It would seem participants didn't want to head into the weekend without protection. When CPCE closes the week at or above 0.90 during an uptrend for SPY, as defined by SPY closing the same trading week above its 20 week simple moving average, this has also been a very bullish sign for SPY over the forward 4 weeks. Since 2003, this has happened 8 times and SPY's forward 2 week returns are higher 6 of 8 for median returns of 2.02%. However, the 2 decliners over the forward 2 weeks are losses of just -0.11% and -0.08%, barely a scratch. SPY's forward 4 week returns are higher 7 of 8 samples for median returns of 2.50%.

In summary, I don't think there's anything to fuss about. Now, if the S&P500 goes against these historical tendencies, and doesn't plant its foot in the ground and turn on a dime to the north at some point over the coming week or two, i'll start to get a bit uncomfortable, especially if we trade below July's low at 2,407. Then we'll have something to fuss about. We do live in unprecedented times, so unprecedented price action is always a possibility, especially if we get unprecedented "fire and fury" between the United States and North Korea. But until then, it's far more likely that these fears are overblown, and I believe we bend but don't break. The bears are notorious for turnovers in their opponents territory, I think the bulls have a good shot of picking one off and taking it back in the other direction. Can you tell I'm ready for the football season to start?
https://steve-deppe.squarespace.com/blog/2017/8/10/sp500-turbulence-whats-the-fuss-about
• DiscoverGold
Click on "In reply to", for Authors past commentaries
*** For Market Direction and Trends visit our board:
https://investorshub.advfn.com/Market-Direction-and-Trends-26249/
Information posted to this board is not meant to suggest any specific action, but to point out the technical signs that can help our readers make their own specific decisions. Your Due Dilegence is a must!
• DiscoverGold
Join the InvestorsHub Community
Register for free to join our community of investors and share your ideas. You will also get access to streaming quotes, interactive charts, trades, portfolio, live options flow and more tools.

