


Sunday, August 13, 2017 9:17:18 PM
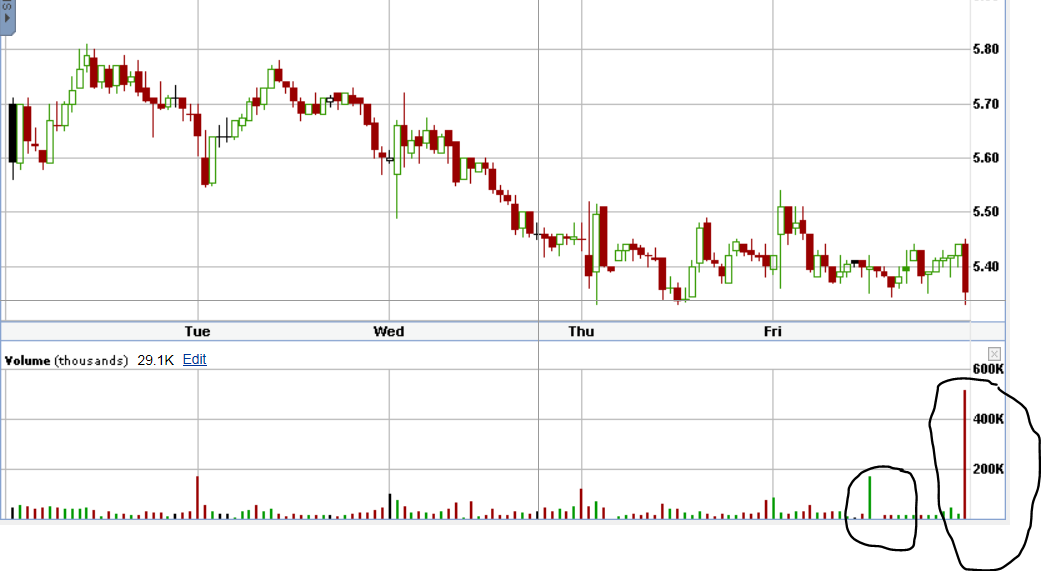
I glanced at a five day chart and the volume candles stuck out to me from this trading range as well.
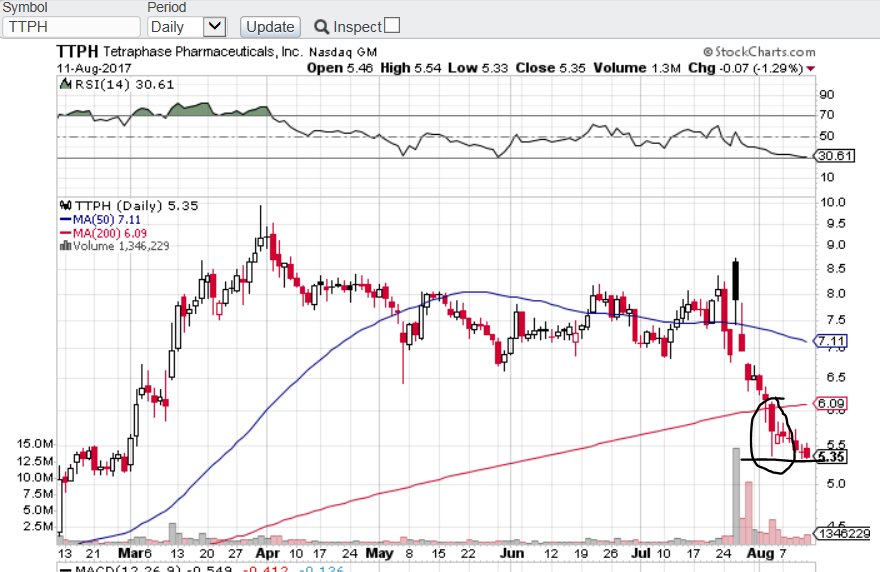
Also noticed on a daily chart that the day the big candle down below $6 occurred on Aug 3rd (day after earnings) where it again dipped to that $5.35 level before seeing high volume and support.
Again, I have much less of a clue as to the in's and out's of technical analysis. Just reaching for straws and looking for trends here. BUT.... It does appear there is support in that range. Guess the coming week will tell if this is the bottom and the share price starts to climb or if it keeps selling off from here.
Fundamentally there's really no justification that I can think of for this continued sell off. Nothing in the earnings was a surprise, the company is in good standings financially, and there are many short term catalysts that are coming soon. With so many shares were just bought for $6.50 like two weeks ago I just cant see it going down much more from here. But I'm probably wrong and it's going to drop to $4.50 lol. Guess we shall see.
I know the red/green volume is supposed to represent a buy vs a sell, but theoretically speaking, doesn't there always have to be a buyer if there is a seller and vice versa? Does it just represent a sell into the bid vs a buy on the ask? Really wish I knew more of the ins and outs as to how that whole process works.

VHAI - Vocodia Partners with Leading Political Super PACs to Revolutionize Fundraising Efforts • VHAI • Sep 19, 2024 11:48 AM
Dear Cashmere Group Holding Co. AKA Swifty Global Signs Binding Letter of Intent to be Acquired by Signing Day Sports • DRCR • Sep 19, 2024 10:26 AM
HealthLynked Launches Virtual Urgent Care Through Partnership with Lyric Health. • HLYK • Sep 19, 2024 8:00 AM
Element79 Gold Corp. Appoints Kevin Arias as Advisor to the Board of Directors, Strengthening Strategic Leadership • ELMGF • Sep 18, 2024 10:29 AM
Mawson Finland Limited Further Expands the Known Mineralized Zones at Rajapalot: Palokas step-out drills 7 metres @ 9.1 g/t gold & 706 ppm cobalt • MFL • Sep 17, 2024 9:02 AM
PickleJar Announces Integration With OptCulture to Deliver Holistic Fan Experiences at Venue Point of Sale • PKLE • Sep 17, 2024 8:00 AM

