:) SPY Weekly Wrap -- Market Indicators Look Bad By Carl Swenlin | June 17, 2017
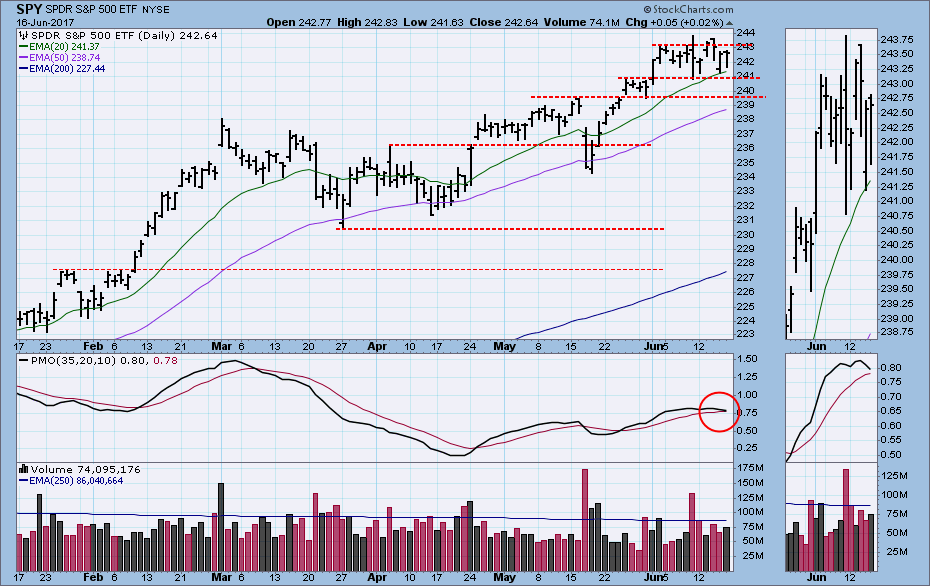
About three weeks ago I began looking for the market to consolidate or correct because of price being very overbought based upon its extreme departure from the 200EMA. So far we have two weeks of price churning sideways, and that has gotten the technical indicators in a condition that promises more of the same, if not an outright correction. Let's take a closer look.
STOCKS
IT Trend Model: BUY as of 11/15/2016
LT Trend Model: BUY as of 4/1/2016
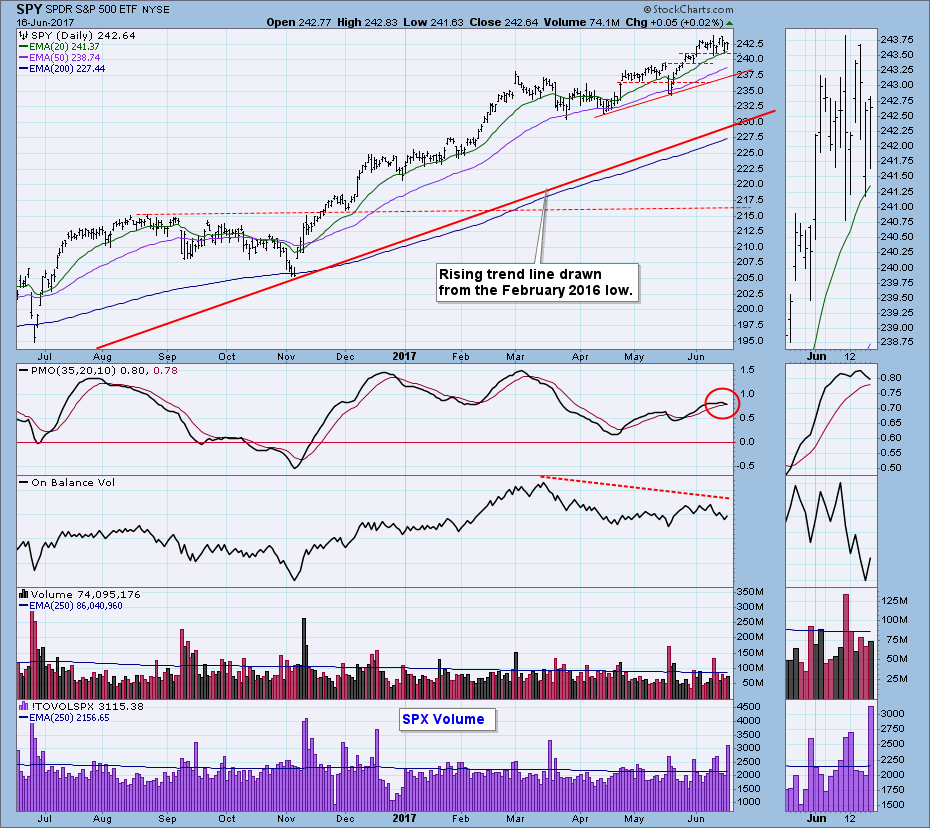
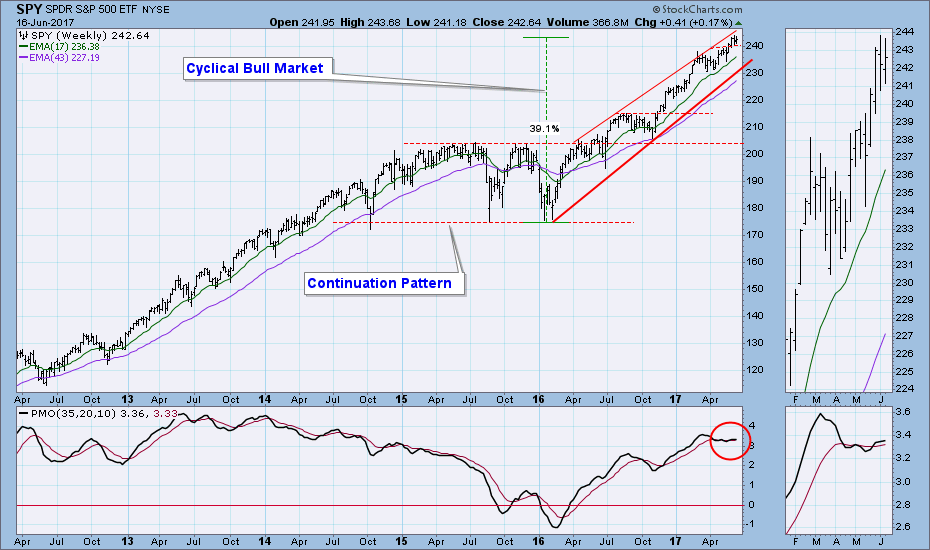
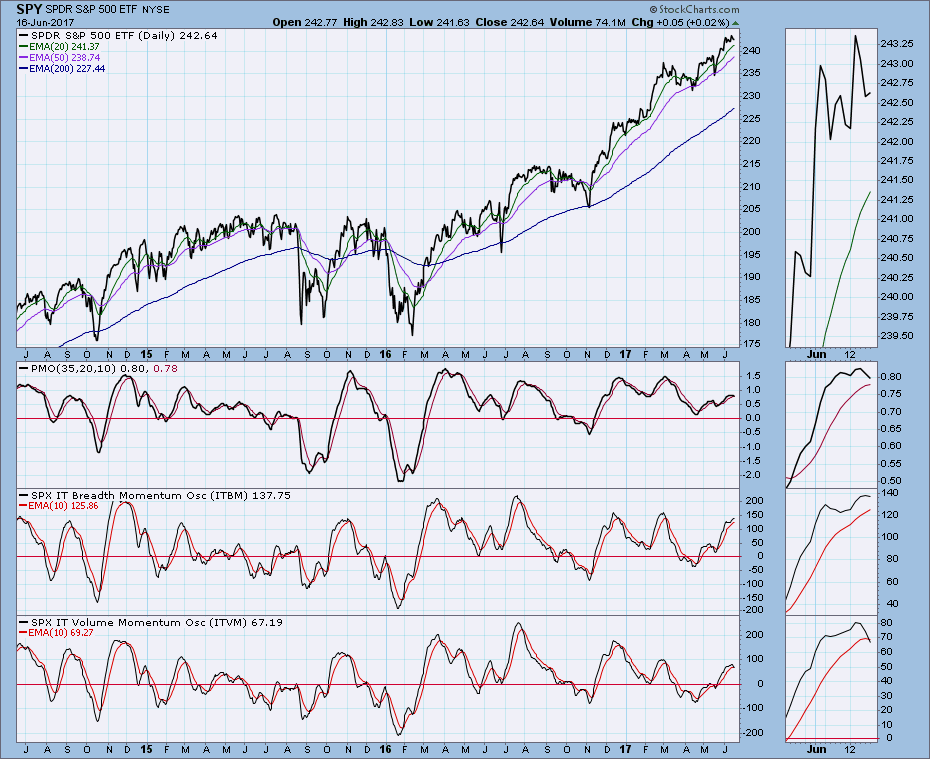
The rising trend line drawn from the February 2016 low defines the current cyclical bull market, and price departure from that line provides one measure of how overbought the market is. Price departure has not reached the extremes of July 2016 or March 2017, but it is still pretty stretched. However, for the last two weeks sideways price movement has relieved a little bit of the pressure. With the daily PMO topping, my best guess is that price will continue to move in a corrective manner for a few more weeks. Note the high S&P 500 volume on Friday -- a byproduct of options expiration.
The weekly PMO is essentially moving sideways, whipsawing up and down. It is not an encouraging configuration, considering that it presents a divergence against rising price.
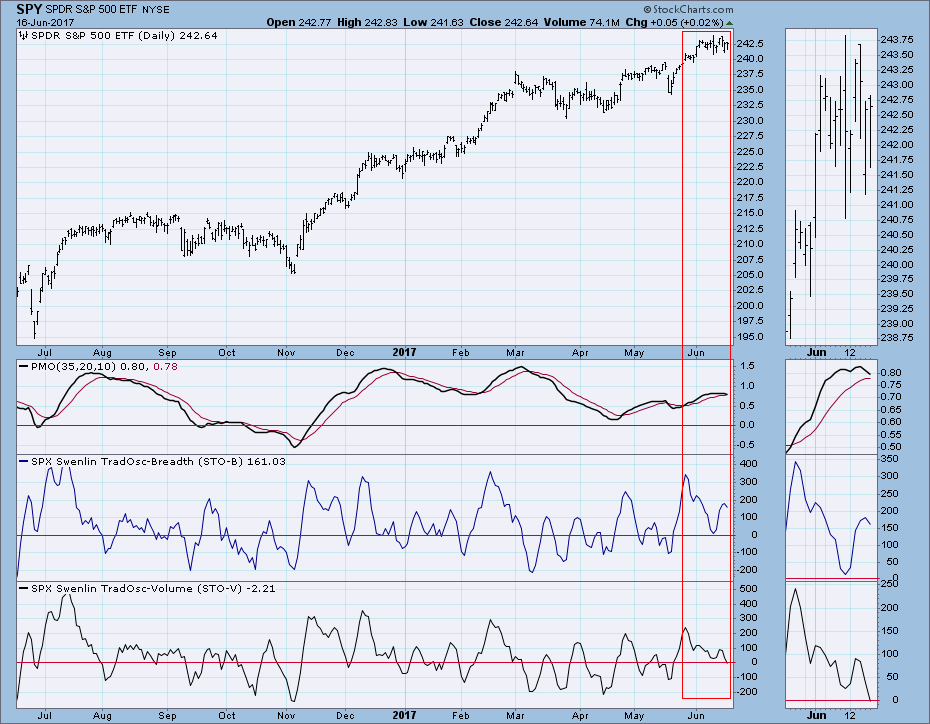
Short-Term Market Indicators: These indicators have topped, implying that more corrective action is likely in this time frame. The STO-V (volume) looks especially weak.
Intermediate-Term Market Indicators: These indicators are somewhat overbought, and they have topped. This configuration implies continued corrective price movement in this time frame.
Conclusion: There were two events this week that tended to keep the market less volatile -- the Fed announcement on Wednesday and Options expiration on Friday. During the last two weeks of consolidation, the market has been showing great reluctance to enter into any kind of decline. There were a couple of days where we started to see some selling, but it dried up before the close. This does not preclude having problems develop in the near future. Our primary short- and intermediate-term indicators are looking dismal, and my assumption is that at the very least the sideways churning will continue for another week or two. Considering the difficulties in the technology sector, the consolidation could morph into a correction rather quickly. . .
Information posted to this board is not meant to suggest any specific action, but to point out the technical signs that can help our readers make their own specific decisions. Your Due Dilegence is a must! • DiscoverGold
Register for free to join our community of investors and share your ideas. You will also get access to streaming quotes, interactive charts, trades, portfolio, live options flow and more tools.


 News
News  Market Data
  Discover