


| Followers | 689 |
| Posts | 143817 |
| Boards Moderated | 35 |
| Alias Born | 03/10/2004 |
Thursday, April 13, 2017 9:22:05 AM
By Erin Heim | April 12, 2017
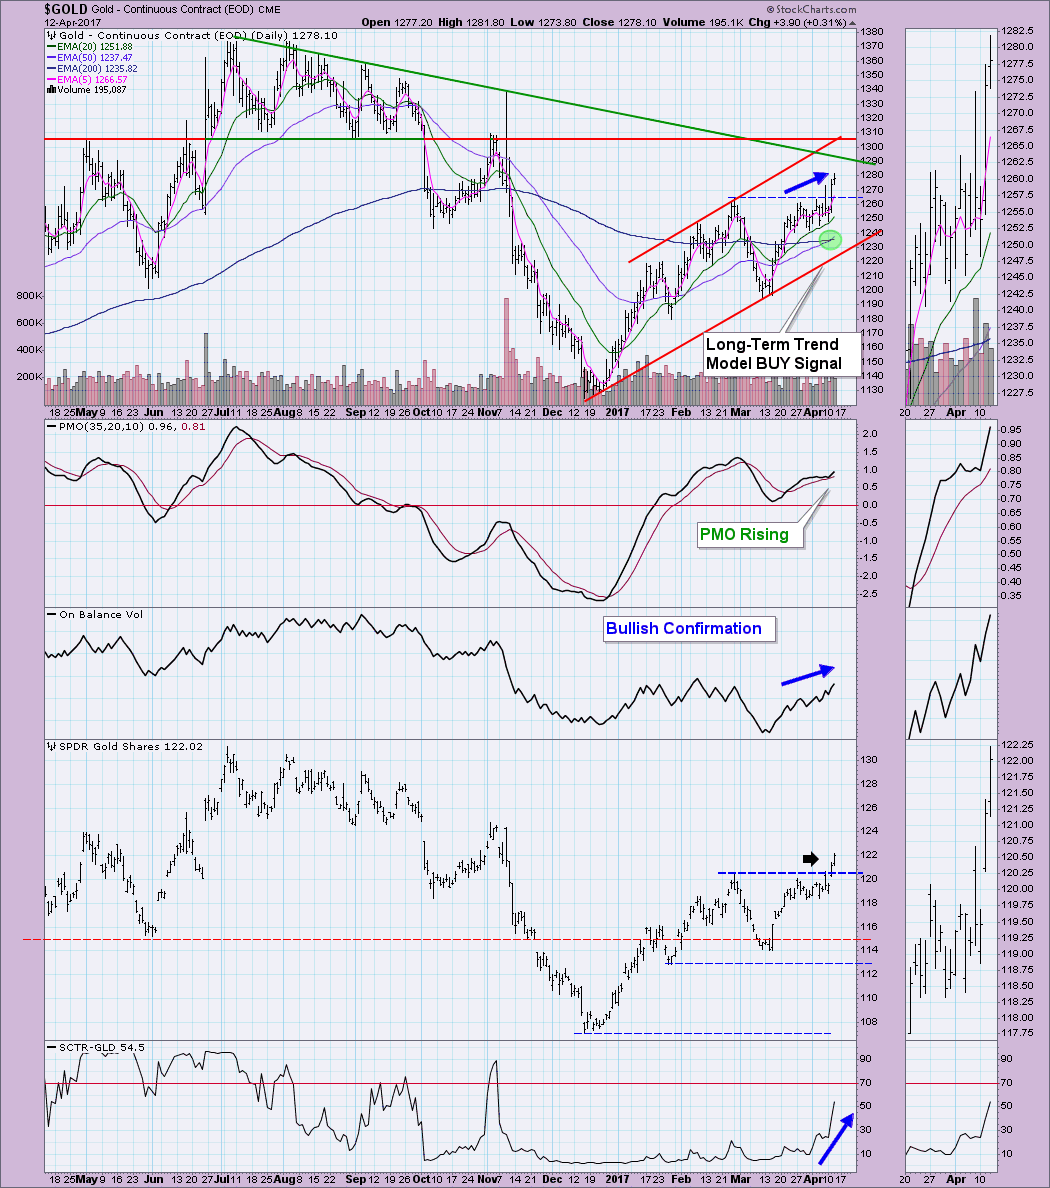
A new Long-Term Trend Model signal triggered on Gold today. This occurs when the 50-EMA crosses above the 200-EMA. When this happens, DecisionPoint theory is that any stock, ETF, index, etc. with a 50-EMA above the 200-EMA is in a technical bull market. What does this mean? If you are in a "bull market" environment, you should expect bullish outcomes over bearish outcomes.
Gold happens to be in an interesting place. I have been bullish on Gold and still am to some degree. The daily chart looks good with a steeply rising Price Momentum Oscillator (PMO) and bullish confirmation of the OBV. The SCTR has a fire under it and should hit the "hot zone" above 75 soon. Gold has some serious overhead resistance to contend with. There are three separate areas of resistance. First, the most important, horizontal resistance at about 1305 that coincides with the November top and July/August/September lows. Greg Morris preaches regularly about the importance of horizontal support and resistance versus trendline resistance which is why I'm looking for a test at 1300. There is trendline resistance to worry about too. The top of the rising trend channel and the longer-term declining tops trendline. Indicators suggest we will finally see a breakout above this resistance area.
The weekly chart gives you another view of overhead resistance. Note that the declining tops line formed in 2012 has held up throughout 2016 and is about to be tested again now. I like the weekly PMO BUY signal and the 17-week EMA preparing to cross above the 43-week EMA.
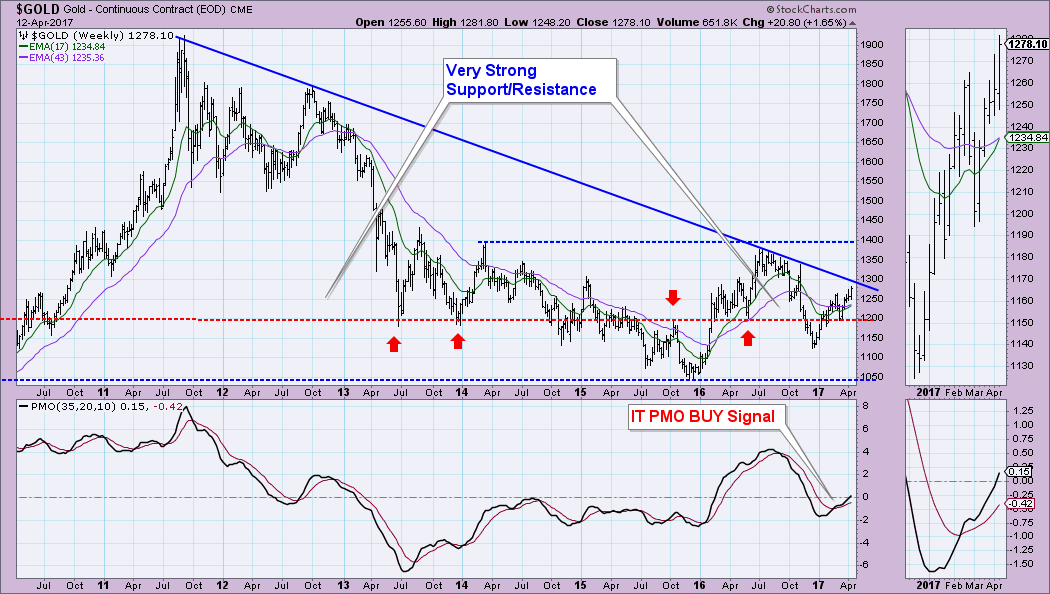
Conclusion: If Gold is going to breakout, this is the time. There is uncertainty in the market which nearly always favors Gold. Indicators look good on both the daily and weekly charts too. The set-up won't get much better.
Technical Analysis is a windsock, not a crystal ball.
Happy Charting!
- Erin
http://stockcharts.com/articles/decisionpoint/2017/04/new-long-term-trend-model-buy-signal-for-gold.html
• DiscoverGold
Information posted to this board is not meant to suggest any specific action, but to point out the technical signs that can help our readers make their own specific decisions. Your Due Dilegence is a must!
• DiscoverGold
Recent GDX News
- YieldMax GDXY Name Change • GlobeNewswire Inc. • 01/25/2024 04:22:00 PM
FEATURED Cannabix Technologies and Omega Laboratories Inc. Advance Marijuana Breathalyzer Technology - Dr. Bruce Goldberger to Present at Society of Forensic Toxicologists Conference • Sep 24, 2024 8:50 AM
FEATURED Integrated Ventures, Inc Announces Strategic Partnership For GLP-1 (Semaglutide) Procurement Through MedWell USA, LLC. • Sep 24, 2024 8:45 AM
Avant Technologies Accelerates Creation of AI-Powered Platform to Revolutionize Patient Care • AVAI • Sep 24, 2024 8:00 AM
VHAI - Vocodia Partners with Leading Political Super PACs to Revolutionize Fundraising Efforts • VHAI • Sep 19, 2024 11:48 AM
Dear Cashmere Group Holding Co. AKA Swifty Global Signs Binding Letter of Intent to be Acquired by Signing Day Sports • DRCR • Sep 19, 2024 10:26 AM
HealthLynked Launches Virtual Urgent Care Through Partnership with Lyric Health. • HLYK • Sep 19, 2024 8:00 AM

