


| Followers | 689 |
| Posts | 143817 |
| Boards Moderated | 35 |
| Alias Born | 03/10/2004 |
Wednesday, March 29, 2017 9:29:25 AM
By Julius de Kempenaer | March 29, 2017
Most of the time Relative Rotation Graphs are used to visualize stock-related universes but please "Don't Ignore the fact" that RRGs can be used to visualize the rotation of any universe that holds comparable securities.
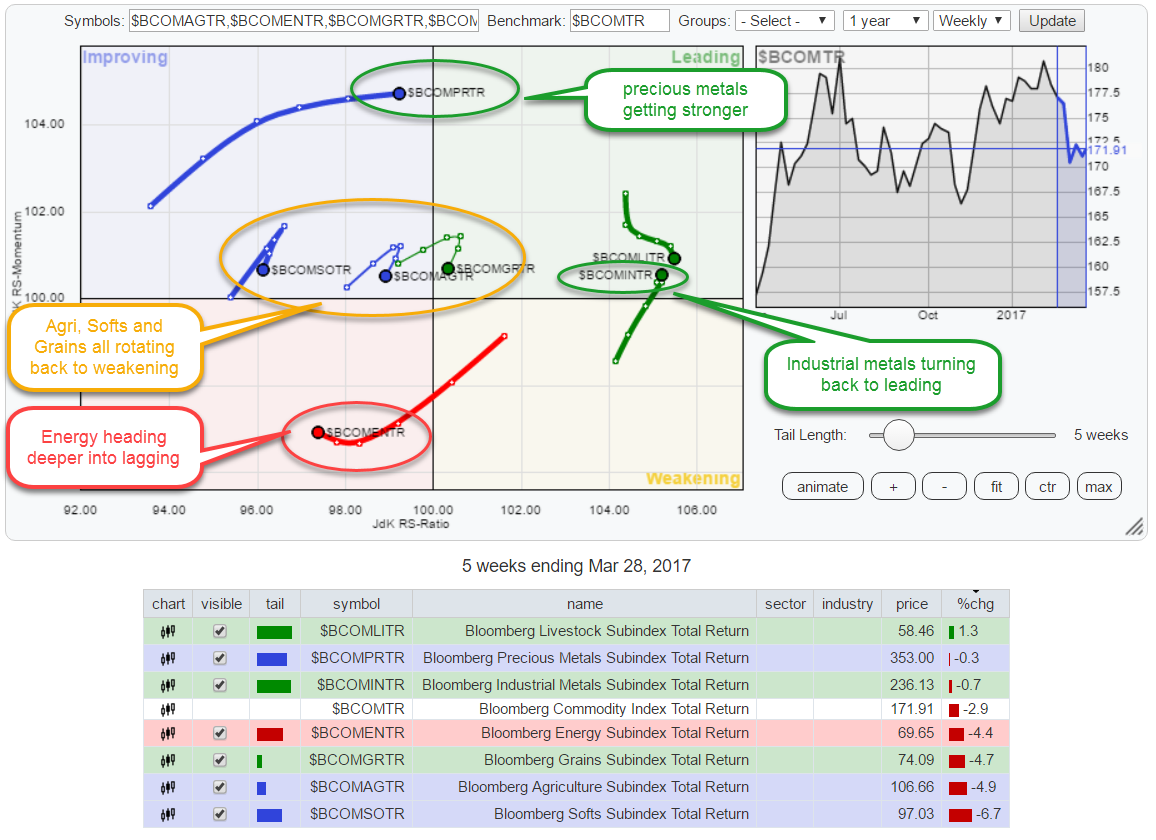
In the chart above I have plotted the rotations for all the sub-groups that make up the Bloomberg Commodity index against the Bloomberg Commodity Index TR ($BCOMTR) as the benchmark in the center.
From this chart, we can get a few helpful takeaways that will provide us with the big picture of what's going on in the commodity landscape and at the same time show us where the strengths and weaknesses for the various sub-groups are.
You can find more information about the composition of this broad commodity index and the target weights for the various sub-groups here.
Two groups stand out on the chart above. Precious Metals ($BCOMPRTR) at the top of the improving quadrant while heading West, backed by a long tail indicating strength. And on the opposite side, Energy ($BCOMENTR) at the bottom of, and already inside, the lagging quadrant.
From a relative perspective, clearly precious metals are preferred. The other, industrial, metals group is found in the leading quadrant and as you can see, just rotated back into that leading quadrant from weakening. Such a rotation usually indicates strength as it marks a new up-leg within an already rising relative trend.
The rotations, and especially the sharp "hooks" back down in the Agriculture, Softs, and Grains groups are worrisome as they point to more weakness ahead for these commodities.
From the Relative Rotation Graph, you can take the ideas to your regular workflow, using your own chart set-ups and templates for further analysis and possible implementation into your portfolio.
Please be aware that the RRG above holds indices but there are plenty of tradable ETNs (iPath series) available that track these commodity groups, as well as individual commodities, which enable you to translate any views to a position.
Julius de Kempenaer | RRG Research
http://stockcharts.com/articles/dont_ignore_this_chart/2017/03/precious-metals-shining-on-relative-rotation-graph.html
• DiscoverGold
Information posted to this board is not meant to suggest any specific action, but to point out the technical signs that can help our readers make their own specific decisions. Your Due Dilegence is a must!
• DiscoverGold
VHAI - Vocodia Partners with Leading Political Super PACs to Revolutionize Fundraising Efforts • VHAI • Sep 19, 2024 11:48 AM
Dear Cashmere Group Holding Co. AKA Swifty Global Signs Binding Letter of Intent to be Acquired by Signing Day Sports • DRCR • Sep 19, 2024 10:26 AM
HealthLynked Launches Virtual Urgent Care Through Partnership with Lyric Health. • HLYK • Sep 19, 2024 8:00 AM
Element79 Gold Corp. Appoints Kevin Arias as Advisor to the Board of Directors, Strengthening Strategic Leadership • ELMGF • Sep 18, 2024 10:29 AM
Mawson Finland Limited Further Expands the Known Mineralized Zones at Rajapalot: Palokas step-out drills 7 metres @ 9.1 g/t gold & 706 ppm cobalt • MFL • Sep 17, 2024 9:02 AM
PickleJar Announces Integration With OptCulture to Deliver Holistic Fan Experiences at Venue Point of Sale • PKLE • Sep 17, 2024 8:00 AM

