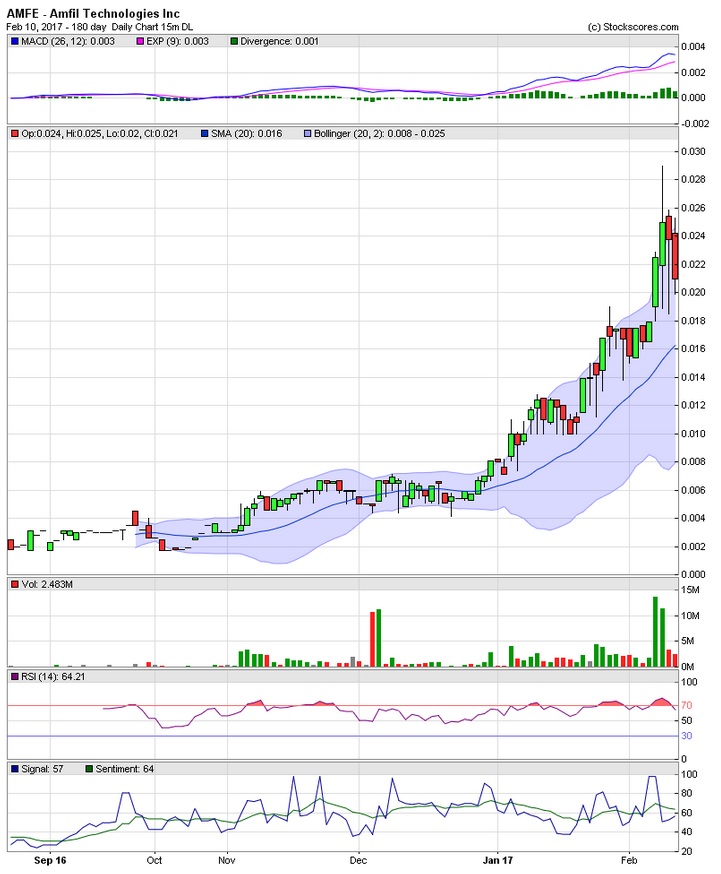
AMFE charts up 27% for the week
* For the week up 27% on volume of 32547134 closing at .0210
* Daily chart show SAR flip, .020 support and .025 resistance showing traders profit taking.
* MEASURED MOVE UP: how to trade it
http://thepatternsite.com/mmu.html
            Share Structure

       Market Value1  $16,630,315 a/o Feb 10, 2017
   Authorized Shares  900,000,000 a/o Jan 01, 2017
  Outstanding Shares  791,919,764 a/o Jan 01, 2017
  -Restricted Not Available  599,059,283 assumed
  -Unrestricted Not Available
  Held at DTC Not Available
               Float   192,860,481 a/o Jan 01, 2017
  Par Value 0.001
 http://www.otcmarkets.com/stock/AMFE/profile
Supports & resistance
http://www.stockta.com/cgi-bin/analysis.pl?symb=AMFE&cobrand=windchart&mode=stock
Moving averages
http://www.profitspi.com/stock-quote/amfe.aspx
US MJ Index real time
http://marijuanaindex.com/stock-quotes/united-states-marijuana-index/
Canadian MJ index
http://marijuanaindex.com/stock-quotes/canadian-marijuana-index/
IHUB Cannabis Stocks 15min delay
http://investorshub.advfn.com/cannabis-stocks/
WEEKLY

2m DAILY

3m DAILY

8/34 DAILY

Chigurh's 6m DAILY RSI masterpiece
 News
News  Market Data
  Discover


