


| Followers | 0 |
| Posts | 148553 |
| Boards Moderated | 7 |
| Alias Born | 03/10/2004 |
Saturday, January 30, 2016 9:06:40 AM
Peek Into Future Through Futures
* January 30, 2016
The following are futures positions of non-commercials as of January 26, 2016. Change is week-over-week.
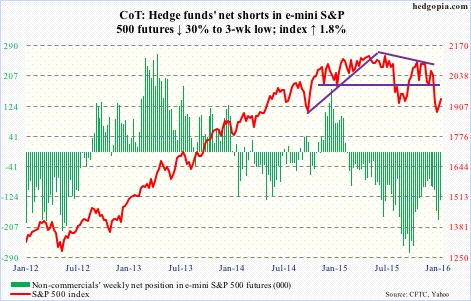
E-mini S&P 500: As of Wednesday, another $1.2 billion came out of U.S.-based equity funds (courtesy of Lipper). Year-to-date, outflows have now totaled north of $27 billion. Since September 30th, $36 billion has left.
This pretty much explains the 5.1-percent decline in the S&P 500 in January (was down as much as 11.3 percent at one point).
That said, there are some signs of buying interest. For the week ended Thursday, $1.9 billion moved into SPY, the SPDR S&P 500 ETF (courtesy of ETF.com). The ETF rose 1.7 percent for the week.
The path of least resistance on the S&P 500 continues to be 1990.
Shorts obviously have done well, and as of mid-January were not rushing to cover. Rather, on both the NYSE and Nasdaq, as well as several leading ETFs, short interest rose in the latest period – potential recipe for mini squeeze. We probably saw some of that on Friday.
Non-commercials, too, had raised net shorts to a 13-week high last week, and cut those down by 30 percent this week.
Currently net short 131.9k, down 56.7k.
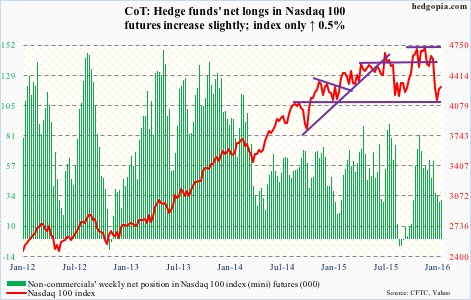
Nasdaq 100 index (mini): It was only up 0.5 percent for the week, substantially underperforming its peers. Apple (AAPL) and Amazon (AMZN) are the primary culprits – down four percent and 1.6 percent, respectively.
Apple (AAPL), with a 11-percent weighting in the Nasdaq 100 and a relative underperformer for a while, has been hurting the index. Post-CY4Q15 earnings, the stock lost 6.6 percent on Wednesday. Once the apple of investors’ eye, Apple suffers from too big a reliance on iPhones.
In the just concluded quarter, iPhones comprised 63 percent of total revenue. The company sold 74.78 million phones. Gargantuan on an absolute basis, but growth is stalling, up a mere one percent year-over-year.
AAPL’s March-quarter revenue guidance of $50 to $53 billion would represent the first quarterly drop since 2003. Even more worrisome, this is what Tim Cook, CEO, said: “We began to see some signs of economic softness in Greater China earlier this month, most notably in Hong Kong.”
Despite AAPL-induced Wednesday sell-off, the Nasdaq 100 is trying to repair damage, with two back-to-back weekly hammers. In an ideal scenario near-term, it has a shot at 4350.
That said, non-commercials are lukewarm to these prospects.
Currently net long 30.3k, up 1.2k.
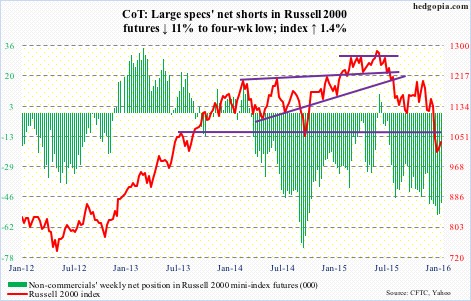
Russell 2000 mini-index: In the week ended Thursday, $1.4 billion moved into IWM, the iShares Russell 2000 ETF (courtesy of ETF.com).
As is the case with the Nasdaq 100, damage repair is in progress. As things stand, the best the bulls can hope for is a move toward 1080.
Two weeks ago, non-commercials had the highest net longs since October 2014. They have since cut those down by 11 percent. If bulls can get their act together, there is room for squeeze.
Currently net short 48.7k, down 6.1k.
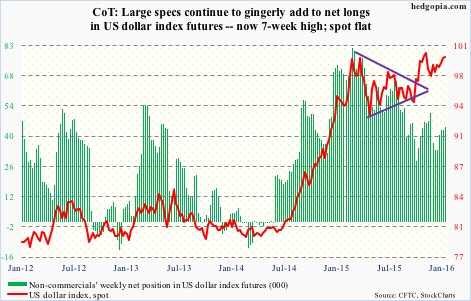
US Dollar Index: In March and November last year, the US dollar index rallied just north of 100, only to retreat. This level is now important technically.
Prior to the BoJ action, the index looked to be wanting to go lower, with the 50-day moving average pointing lower and weekly momentum indicators weakening.
Friday, on the coattails of the BoJ action, the dollar index rallied one percent, but still not enough to push it past the afore-mentioned resistance.
Once again, judging by non-commercials’ holdings, no breakout is imminent. They have been grudgingly adding to net longs the past five weeks… holdings pale in comparison to what they had leading to the March high last year.
Currently net long 44.2k, up 1.5k.
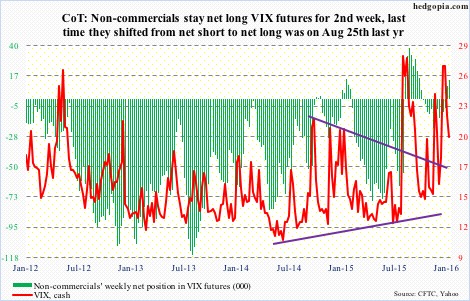
VIX: For the first time since August 25th, non-commercials went net long last week. This week, they added.
If past is prelude, non-commercials shifting from net short to net long coincides with a peak in the spot. So far, this is precisely how things have unfolded.
If there is a spot for volatility bulls to put their foot down, this is it. The spot (20.20) is sitting at support, which also approximates its 50-day moving average.
Currently net long 14.2k, up 4.7k.
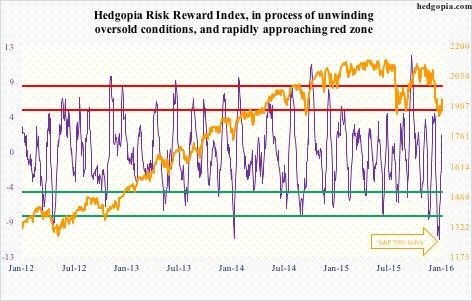
Hedgopia Risk Reward Index
http://www.hedgopia.com/cot-peek-into-future-through-futures-28/
• George.
Click on "In reply to", for Authors past commentaries.
* January 30, 2016
The following are futures positions of non-commercials as of January 26, 2016. Change is week-over-week.
E-mini S&P 500: As of Wednesday, another $1.2 billion came out of U.S.-based equity funds (courtesy of Lipper). Year-to-date, outflows have now totaled north of $27 billion. Since September 30th, $36 billion has left.
This pretty much explains the 5.1-percent decline in the S&P 500 in January (was down as much as 11.3 percent at one point).
That said, there are some signs of buying interest. For the week ended Thursday, $1.9 billion moved into SPY, the SPDR S&P 500 ETF (courtesy of ETF.com). The ETF rose 1.7 percent for the week.
The path of least resistance on the S&P 500 continues to be 1990.
Shorts obviously have done well, and as of mid-January were not rushing to cover. Rather, on both the NYSE and Nasdaq, as well as several leading ETFs, short interest rose in the latest period – potential recipe for mini squeeze. We probably saw some of that on Friday.
Non-commercials, too, had raised net shorts to a 13-week high last week, and cut those down by 30 percent this week.
Currently net short 131.9k, down 56.7k.

Nasdaq 100 index (mini): It was only up 0.5 percent for the week, substantially underperforming its peers. Apple (AAPL) and Amazon (AMZN) are the primary culprits – down four percent and 1.6 percent, respectively.
Apple (AAPL), with a 11-percent weighting in the Nasdaq 100 and a relative underperformer for a while, has been hurting the index. Post-CY4Q15 earnings, the stock lost 6.6 percent on Wednesday. Once the apple of investors’ eye, Apple suffers from too big a reliance on iPhones.
In the just concluded quarter, iPhones comprised 63 percent of total revenue. The company sold 74.78 million phones. Gargantuan on an absolute basis, but growth is stalling, up a mere one percent year-over-year.
AAPL’s March-quarter revenue guidance of $50 to $53 billion would represent the first quarterly drop since 2003. Even more worrisome, this is what Tim Cook, CEO, said: “We began to see some signs of economic softness in Greater China earlier this month, most notably in Hong Kong.”
Despite AAPL-induced Wednesday sell-off, the Nasdaq 100 is trying to repair damage, with two back-to-back weekly hammers. In an ideal scenario near-term, it has a shot at 4350.
That said, non-commercials are lukewarm to these prospects.
Currently net long 30.3k, up 1.2k.

Russell 2000 mini-index: In the week ended Thursday, $1.4 billion moved into IWM, the iShares Russell 2000 ETF (courtesy of ETF.com).
As is the case with the Nasdaq 100, damage repair is in progress. As things stand, the best the bulls can hope for is a move toward 1080.
Two weeks ago, non-commercials had the highest net longs since October 2014. They have since cut those down by 11 percent. If bulls can get their act together, there is room for squeeze.
Currently net short 48.7k, down 6.1k.

US Dollar Index: In March and November last year, the US dollar index rallied just north of 100, only to retreat. This level is now important technically.
Prior to the BoJ action, the index looked to be wanting to go lower, with the 50-day moving average pointing lower and weekly momentum indicators weakening.
Friday, on the coattails of the BoJ action, the dollar index rallied one percent, but still not enough to push it past the afore-mentioned resistance.
Once again, judging by non-commercials’ holdings, no breakout is imminent. They have been grudgingly adding to net longs the past five weeks… holdings pale in comparison to what they had leading to the March high last year.
Currently net long 44.2k, up 1.5k.

VIX: For the first time since August 25th, non-commercials went net long last week. This week, they added.
If past is prelude, non-commercials shifting from net short to net long coincides with a peak in the spot. So far, this is precisely how things have unfolded.
If there is a spot for volatility bulls to put their foot down, this is it. The spot (20.20) is sitting at support, which also approximates its 50-day moving average.
Currently net long 14.2k, up 4.7k.

Hedgopia Risk Reward Index

http://www.hedgopia.com/cot-peek-into-future-through-futures-28/
• George.
Click on "In reply to", for Authors past commentaries.
Information posted to this board is not meant to suggest any specific action, but to point out the technical signs that can help our readers make their own specific decisions. Your Due Dilegence is a must!
• gtsourdinis


