


| Followers | 0 |
| Posts | 148553 |
| Boards Moderated | 7 |
| Alias Born | 03/10/2004 |
Saturday, January 09, 2016 10:48:11 AM
Peek Into Future Through Futures
* January 9, 2016
The following are futures positions of non-commercials as of January 5, 2016. Change is week-over-week.
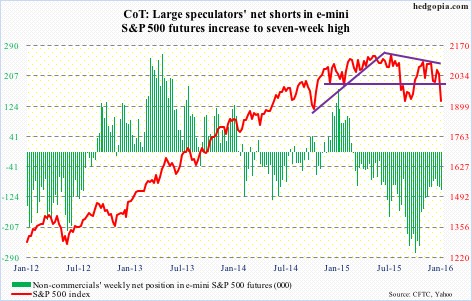
E-mini S&P 500: Flows continued their recent downward trend. In the week ended Wednesday, $12 billion flew out of U.S.-based equity funds (courtesy of Lipper). This more than offset last week’s $10-billion inflows. In the past five weeks, north of $32 billion have been withdrawn.
No wonder December was a down month. Going back to the September 30th, when the S&P 500 was in the process of bottoming, nearly $21 billion have come out of these funds. Not surprisingly, the index is not that far away from those lows.
With the rout this week, there has been technical damage wrought on the index. It fell out of a two-plus-month descending channel as well as lost 1990. The sooner it regains that level, the better. In a worse-case scenario, August and September lows could be in play. Alternatively, it drops to 1900 and finds support at the trend line drawn from the August low.
On a weekly basis, there is room for the index to continue lower, even as daily momentum indicators are in/approaching oversold territory. Near-term, a reprieve is possible. Medium- to long-term, the index can head a lot lower.
Non-commercials added a little to net shorts, but holdings are substantially less than during September/October last year.
Currently net short 104.2k, up 7k.
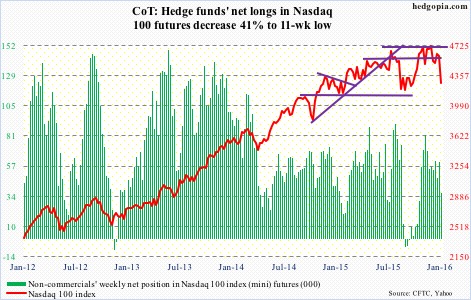
Nasdaq 100 index (mini): Last week, the Nasdaq 100 lost 4560, which has proven to be an important line in the sand between bulls and bears. This week, it lost the 200-day moving average.
Importantly, Apple (AAPL), which makes up nearly 13 percent of the index, lost crucial support at $105-plus, completing a head-and-shoulders pattern.
More importantly, the Nasdaq 100 rallied a very strong 8.4 percent – relatively speaking – last year. But this was driven primarily by the likes of Facebook (FB), Amazon (AMZN), Netflix (NFLX) and Alphabet (GOOGL, formerly Google). Otherwise, breadth was much weaker.
Non-commercials reduced net longs to an 11-week low – timely.
Currently net long 36k, down 25k.
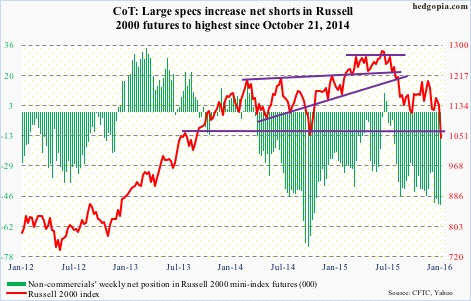
Russell 2000 mini-index: Back in late September when the S&P 500 successfully tested the August low, the Russell 2000 index, along with the S&P 400 mid-cap index, was one of the major U.S. indices to have undercut those lows.
Investors/traders were avoiding small-caps then, and they are avoiding them now. This week, the Russell 2000 undercut the September low as well.
And once again, kudos to non-commercials for having so doggedly remained bearish Russell 2000 futures. They have been rewarded.
Net shorts are at the highest since October 2014.
Currently net short 50.4k, up 852.
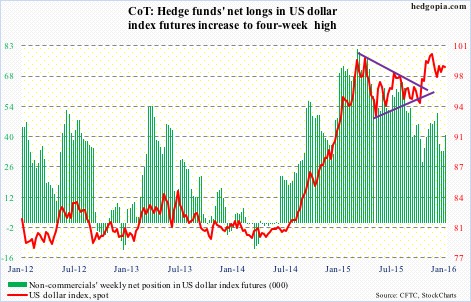
US Dollar Index: Rather uncharacteristically, the dollar index failed to rally on the coattails of this week’s market turmoil.
Yes, the Japanese yen is the pre-eminent risk-averse currency and yes the euro has become a safe-haven proxy along with the yen, but the index’s inability to break out is probably one more sign of waning momentum.
Judging by their holdings, non-commercials have been hinting at this for a while now. Two weeks ago, they cut back net longs to a nine-week low. This week, they added some.
A peak in the dollar is music to the ears of U.S. exporters.
Currently net long 40.7k, up 7.1k.
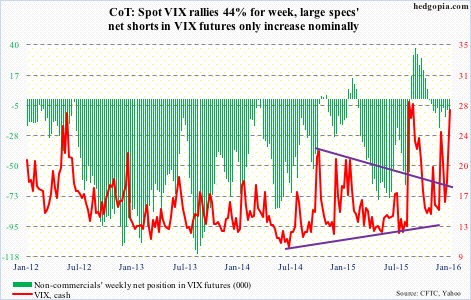
VIX: On December 14th, spot VIX shot up to 26.81 before reversing hard. The S&P 500 this week undercut the intra-day low in that session by 3.8 percent, yet VIX could barely surpass the intra-day high back then.
Also, the S&P 500 is less than three percent from testing the August low, yet VIX has to nearly double to reach the intra-day high back then.
It is so uncharacteristic of VIX – not able to rally when the S&P 500 is taking it on the chin.
Investors/traders were either already protected or do not anticipate a bigger decline in stocks. That is one way to look at this. Using this logic, the time is perhaps right to look for signs of a spike-reversal. Not there yet.
The VIX:VXV ratio is now overbought – 1.03 – ripe enough to begin to unwind, which, should it happen, should bode well for stocks. But it needs to begin to drop.
Currently net short 9.8k, up 1.4k.
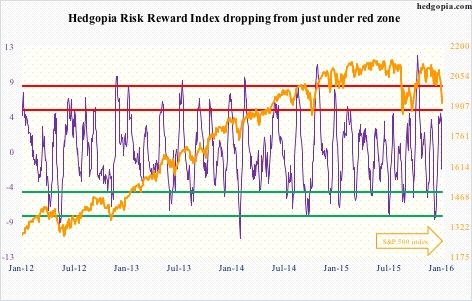
Hedgopia Risk Reward Index
http://www.hedgopia.com/cot-peek-into-future-through-futures-25/
• George.
Click on "In reply to", for Authors past commentaries.
* January 9, 2016
The following are futures positions of non-commercials as of January 5, 2016. Change is week-over-week.
E-mini S&P 500: Flows continued their recent downward trend. In the week ended Wednesday, $12 billion flew out of U.S.-based equity funds (courtesy of Lipper). This more than offset last week’s $10-billion inflows. In the past five weeks, north of $32 billion have been withdrawn.
No wonder December was a down month. Going back to the September 30th, when the S&P 500 was in the process of bottoming, nearly $21 billion have come out of these funds. Not surprisingly, the index is not that far away from those lows.
With the rout this week, there has been technical damage wrought on the index. It fell out of a two-plus-month descending channel as well as lost 1990. The sooner it regains that level, the better. In a worse-case scenario, August and September lows could be in play. Alternatively, it drops to 1900 and finds support at the trend line drawn from the August low.
On a weekly basis, there is room for the index to continue lower, even as daily momentum indicators are in/approaching oversold territory. Near-term, a reprieve is possible. Medium- to long-term, the index can head a lot lower.
Non-commercials added a little to net shorts, but holdings are substantially less than during September/October last year.
Currently net short 104.2k, up 7k.

Nasdaq 100 index (mini): Last week, the Nasdaq 100 lost 4560, which has proven to be an important line in the sand between bulls and bears. This week, it lost the 200-day moving average.
Importantly, Apple (AAPL), which makes up nearly 13 percent of the index, lost crucial support at $105-plus, completing a head-and-shoulders pattern.
More importantly, the Nasdaq 100 rallied a very strong 8.4 percent – relatively speaking – last year. But this was driven primarily by the likes of Facebook (FB), Amazon (AMZN), Netflix (NFLX) and Alphabet (GOOGL, formerly Google). Otherwise, breadth was much weaker.
Non-commercials reduced net longs to an 11-week low – timely.
Currently net long 36k, down 25k.

Russell 2000 mini-index: Back in late September when the S&P 500 successfully tested the August low, the Russell 2000 index, along with the S&P 400 mid-cap index, was one of the major U.S. indices to have undercut those lows.
Investors/traders were avoiding small-caps then, and they are avoiding them now. This week, the Russell 2000 undercut the September low as well.
And once again, kudos to non-commercials for having so doggedly remained bearish Russell 2000 futures. They have been rewarded.
Net shorts are at the highest since October 2014.
Currently net short 50.4k, up 852.

US Dollar Index: Rather uncharacteristically, the dollar index failed to rally on the coattails of this week’s market turmoil.
Yes, the Japanese yen is the pre-eminent risk-averse currency and yes the euro has become a safe-haven proxy along with the yen, but the index’s inability to break out is probably one more sign of waning momentum.
Judging by their holdings, non-commercials have been hinting at this for a while now. Two weeks ago, they cut back net longs to a nine-week low. This week, they added some.
A peak in the dollar is music to the ears of U.S. exporters.
Currently net long 40.7k, up 7.1k.

VIX: On December 14th, spot VIX shot up to 26.81 before reversing hard. The S&P 500 this week undercut the intra-day low in that session by 3.8 percent, yet VIX could barely surpass the intra-day high back then.
Also, the S&P 500 is less than three percent from testing the August low, yet VIX has to nearly double to reach the intra-day high back then.
It is so uncharacteristic of VIX – not able to rally when the S&P 500 is taking it on the chin.
Investors/traders were either already protected or do not anticipate a bigger decline in stocks. That is one way to look at this. Using this logic, the time is perhaps right to look for signs of a spike-reversal. Not there yet.
The VIX:VXV ratio is now overbought – 1.03 – ripe enough to begin to unwind, which, should it happen, should bode well for stocks. But it needs to begin to drop.
Currently net short 9.8k, up 1.4k.

Hedgopia Risk Reward Index

http://www.hedgopia.com/cot-peek-into-future-through-futures-25/
• George.
Click on "In reply to", for Authors past commentaries.
Information posted to this board is not meant to suggest any specific action, but to point out the technical signs that can help our readers make their own specific decisions. Your Due Dilegence is a must!
• gtsourdinis


