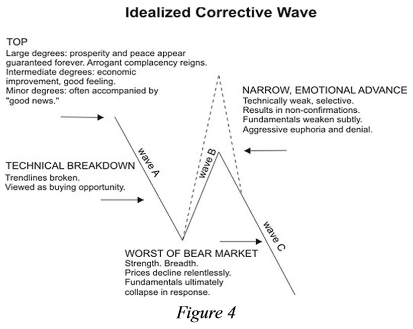
Think the current conditions in the stock market are normal? Think again. Robert Prechter explains in this excerpt from pages 3-4 of his just-published Elliott Wave Theorist ... Figure 4 (below) is a diagram from Chapter 2 of Elliott Wave Principle. It displays a typical progression of prices and psychology in a bear market. We can apply this picture to the stock market since 2000. The real-life pattern is a bit more complex than this picture, because wave a itself was a flat correction, which ended in 2009. The dashed line in Figure 4 represents what the market has been doing since then: rallying to a new high in a b-wave. The entire formation has been tracing out an "expanded flat" correction (see text, p.47) of Supercycle degree.
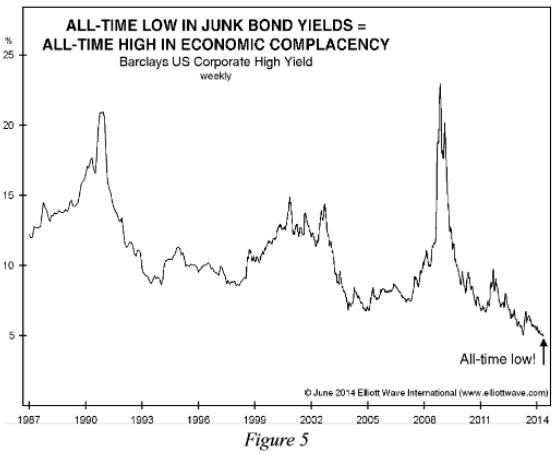
Per Figure 4, among the characteristics we should expect to see in wave b are: "Technically weak," "Aggressive euphoria and denial" and "Fundamentals weaken subtly." The volume contraction in the stock market has now lasted over five years, which is extreme technical weakness, albeit only in that indicator. The 30+ charts we have shown of market sentiment reveal historically high levels of optimism regarding stocks. No doubt bulls would dismiss the idea that investors today exhibit "aggressive euphoria and denial." But look at Figure 5.
It shows that the yield on junk bonds has just reached its lowest level ever. Junk bonds did not even exist prior to 1989. In 2009, investors were deathly afraid of them. Now they cannot get enough of them. They are thinking only about yield; they are ignoring risk to principal. That's denial. Finally, fundamentals have not just weakened a bit but rather are awful. The economy is flat, the amount of debt is at a record high, and as shown in the June issue of The Elliott Wave Financial Forecast the quality of debt is at a record low.
There has never been an expanded flat pattern as large as Supercycle degree in recorded stock market history, going back 300 years. It's a first. So, we are getting commensurate expressions of stupendous optimism, which will prove worthy of the record books. People think today's market conditions are normal, because a benign present is always considered normal. But it's not normal. It's unprecedented. For more details, our complete wave count, and our forecast for how we believe it will all play out, continue reading Prechter's 10-page June Theorist now, completely risk-free.
You can read the entire issue, plus the Financial Forecast and Short Term Update. This group of publications, the Financial Forecast Service, is EWI's most popular package for U.S. investors.
The Financial Forecast Service gives you in-depth coverage of U.S. markets three times a week plus intermediate-term forecasts once a month and big-picture analysis at least 12 times a year. Be prepared for the risks and opportunities to come. You won't find a more valuable big-picture technical analysis package available anywhere. Period.
For a limited time, you can get your first month of all three publications for just $29 -- risk free for 30 days. That's more than half off the already discounted package price.
Get your special offer, and prepare now for risks and opportunities in U.S. markets >> SPECIAL OFFEER
Register for free to join our community of investors and share your ideas. You will also get access to streaming quotes, interactive charts, trades, portfolio, live options flow and more tools.
 News
News  Market Data
  Discover