 News
News  Market Data
  Discover
Support: 888-992-3836
Copyright © 2023 InvestorsHub Inc.


bioscript
![]()
Register for free to join our community of investors and share your ideas. You will also get access to streaming quotes, interactive charts, trades, portfolio, live options flow and more tools.
Register for free to join our community of investors and share your ideas. You will also get access to streaming quotes, interactive charts, trades, portfolio, live options flow and more tools.
Simple...Things have been going well. I see I have been missing quite a bit. Goodman waves? Never heard of them before...guess I have some studying to do!
I have been busy with my full time job as a CPA since business has picked up quite a bit this year. Still managing to trade although the number of trades I have taken this year is significantly lower than in years past. I've also made some real estate investments this year which is a whole new realm so I've been focusing some time with those.
The trading bug is starting to kick in and I'm sure that a few hours with the charts and catching up with the boards will have it out in full force. Definitely looking forward to 2012.
Pennies...just saw your PM from back in October. I apologize for not responding sooner as today is the first day I've checked the boards in quite some time. I don't have a subscription but I sent you an email to your nettechs email address I had.
Anyway, I hope everyone has been well!
daiello...you bring some interesting points to light that have been debated for years. How can you predict the future value of assets? Unfortunately I haven't come across any perfect answers to this question. You can use quantitative methods based looking at numerous measures to calculate what the future value of an asset is. However, there are many methods for doing this and each will come up with a different value. These methods don't take into account the unexpected events that occur in real life.
Then you have the technical method involving the use of past prices to predict future prices. Again, this method doesn't account for unexpected events.
I guess the point is that we are not going to be able to know when unexpected events are going to occur and we must have a way of handling them. Additionally, we are never going to be able to predict the future value of assets with 100% accuracy and if we did have the ability to do so then we wouldn't be predicting anymore.
Large firms on wall street such as goldman run risk models on their portfolio's constantly in order to ensure that they can handle any events that come down the pike. Black Swan's do happen and unfortunately we cannot predict when they will...we just need to ensure that we put ourselves in a position to mitigate the impact they may have on our portfolios.
Jav, the fib and TL meet around 0.8359. Drawing channels is tricky and there can be differences between brokers so that may be the reason why you are not seeing the exact same prices I am. But the key is to get an idea where price is likely to turn. If I can't watch the charts, I will set limit orders. If I can watch then I switch to a smaller time frame and look for typical reversal type patters like double tops, divergence, certain types of candles like pin bars or bearish/bullish outside bars or inside bars.
Very possible there is yen weakness on the horizon. I don't like the overall look of g/j. The channel does look like a flag and if it plays out, it could run to 1.43 which would be a nice gain. I would wait for a break of the channel and then a retest to get long.
USDCAD: I would be looking to buy near the bottom of the channel. There is also a previous low there.

The charts are from InterbankFX. If you move out to a daily chart, it'll be easier to draw the channel I have.
You can see that GBPCHF has a similar type of channel in play. The swissie is strong these days...everyone flocking there in hopes of safety given the current situations of both the US and the EU.
Remember, the market can stay solvent longer than we can!

CADJPY approaching resistance...may be good for a drop.

USDCHF...I know there has been some discussion on this pair as of late. I am watching the fib + TL confluence area as a strong resistance.
Jav, I definitely do much better playing 4hr charts. Glad the charts help.

EURJPY may turn around the Resistance + Fib confluence

GBPUSD

We always hear about risk reward in forex, unfortunately, with all the B/S in the markets I believe it's tough to be more right than wrong, UNLESS you drop your reward and keep your risk the same, so a 1:1 or even risk 2 for 1 reward.
So to sum things up, how would you trade given the following strategy. Do you take your 5-10% gains (risking 10-15% loss) or do you take more b/e trades anticipating big winners.
AUDUSD...I am watching this as a possible setup:

Here is an interesting view of the dollar. Note that this chart is upside down.
You can also see it here if the chart doesn't show up right: http://2.bp.blogspot.com/-cQYP5_cGB6w/Thmw3W3GhjI/AAAAAAAACas/UZRrgVKmioY/s1600/2011-07-08_2352_Dollar_Inverted_All_Data_withGaps-01.png
Here is a link to the blog: http://m3financialsense.blogspot.com/

Thanks git, I never really went anywhere...I still lurk in the shadows. Work keeps me busy and takes away from the time I use to spend trading. Although I must say that I have done very well integrating my job and trading. I am also very blessed to be among the employed especially with unemployment creeping back up and more and more families losing their homes every day.
Gotta enjoy the right to trade now before those who have our best interest decide that we the people are no longer worthy.
Pennies,
Great to see you are back posting again! Breen sent me a PM on forexfactory and he seems to be doing well and recovering from the losses he took last year.
A picture is worth a thousand words so here is mine:

Things are going well. I profited on 5 trades, broke even on 1, and lost 2 so far this year. I have a short on a/j running now which is in the positive so we'll see how it plays out. Not doing too bad for only putting in a few hours of chart time a week and swinging away :)
I would be careful on e/u it looks like it broke out of a bull flag which I would peg as a b wave so 5 to the upside is likely if my counts are correct. Either way, I think 1.40 is the line in the sand and a great place to take some low risk shorts.
I've been chatting with Villas in the skype room every night from around 9pm to 11pm est so stop by if you are around. Although this week I may be a bit scarce since we have to be done with the domestic audit on the client I am working on now by Friday.
Pennies,
Here is my e/u view for the time being. 1.3980 area will be a tough nut to crack. The 76.4 fib is at that level along with a large monthly resistance level I have. On top of that we have c=.618a right in that area.

Good news! bio is still alive :) Hope everyone is doing well and 2011 is treating everyone well. I opened my books last week and am ready to get back at it. Took 2 trades so far this year one loss and one win but net profit overall. Gotta love the power of money management.
I have been busy and will continue to be through the end of March but will still make time for trading. I took a new job working as an auditor for a big 4 accounting firm here in Philly. I have also been working on starting up a business in the IPTV realm. And my most recent activity has involved an investment in real estate. Putting those hard earned gains from 2010 to work!
Anyway I'll check in from time to time and I still also check in to skype. Stay in touch! Feel free to email me as well:
matthew.a.harbaugh@gmail.com
~bioscript
joanneg, the wave (iv) lows are around 1.37 so a break of this level will send us towards 1.27-1.28 rather quickly. It will be a sign that wave 3 to the downside is starting which will coincide with a fierce bullish movement in the dollar index which will also begin its wave 3 move to the upside. If I'm not mistaken, Pennies is expecting a bit more of a drop yet on the dollar index which would coincide with a final push towards the red trend line.
Here are my E/U counts: 2 charts here. First is the weekly so you can get an idea of the larger picture and what I'm seeing and the second is the daily with a close up of where we are currently and what I'm seeing in the short term.
Wave (v) in brown of wave c in green of wave 2 in blue may be complete however, I don't see any clear divergence on a 1hr or 4hr chart to indicate it is complete. There is divergence forming on the daily which may need a bit more time to mature. At this point I cannot rule out final push towards the trend line. A break below the wave (iv) in brown lows will be confirmation that this correction is over.


Saturdays are not necessarily the best days to hunt for the reasons you mention. Although I've noticed that there has been a significant decline in the amount of people who hunt in the area I do. When I first started hunting, I remember running into everyone and their brother in the woods. But as of the last few years this hasn't been the case. The whitetail population here in PA has decreased significantly in the areas where I hunt.
You are correct, there is always a need for auditors. My plan is to get my CPA and a couple of years experience then maybe do my own thing. Hopefully my own thing consists of primarily trading and a bit of accounting work on the side. Unless I hit the lottery or invent the next facebook by that time. Then I'll probably head more in your direction and go to a secluded area and enjoy the outdoors.
Well the semester is flying by rather quickly. I just had fall break and looks like I'll be graduating in mid-December. Already have a job lined up working in the grand old field of auditing at one of the big four accounting firms which I'll start in January so that will throw a wrench in my trading for a bit. But no worries, one thing my 5 year stint in the military taught me was to adapt and overcome! But I guess thats nothing new either...thats what trading is all about.
I am looking forward to doing a bit of flintlock hunting here in PA come Christmas time. I like the challenge involved with open sights and not knowing whether or not your gun is actually going to fire.
Hey cAt, long time no see. I figured I'd check in and see how things were going. I trust all is well. I've been away from the board for some time taking care of some family issues as well as finishing up my last semester of classes. But I am still hammering my way around the wild world of forex as usual. Are you still running your website as well?
bio
I've actually been gone for the past week or so visiting family. Plus I had midterms the week before so I've been preoccupied. I'll definitely be getting back into the swing of things this week. I'll be sure to post anything I find of value.
Simple,
I believe Pennies is exhausted. I know he had the infamous cold bug that has been going around and he has been working like a dog. He hasn't checked in on skype since Saturday but I'm sure he'll be back soon. Sometimes we all just need to take some time to recharge the old batteries.
Hope all is well,
~bio
Hey BT, I think you're right. The question I ask is how much QE2 is priced in? Something else that doesn't make sense to me is the fact that they've come out and said that the recession is over and things are getting better in the economy. Yet they still talk about QE2...if things are so good or getting better why do we need QE2? All of the talks about QE2 make me think that things are a lot worse than they are telling us.
Simple,
EW counting works on all time frames and any instrument you can imagine. There are a few different special rules for certain instruments such as commodities and leveraged instruments. In commodities you will typically see wave 5 be the strongest wave as opposed to wave 3. Also in leveraged instruments wave 4 sometimes violates wave 1 however the violation isn't typically very deep. I've gone through a few different DOW charts to try and lay out the reasons why EW theory tells us the markets are going to drop. Here is a look and below each chart is an explanation. I apologize that the labels may look a bit messy but hopefully you get the point.

Here we see a DOW chart from 1900 through 2009. Now the roaring 20s was considered a great time of prosperity and this culminates in wave 1. The 1929 crash and the great depression make up wave 2. Now following wave 2 you can see a 5 wave structure (I've labeled them i,ii,iii,iv,v) which concludes wave 3 at the 14000 highs. Now if you look at the wave iv of wave 3 which is a lot of sideways action, you will see the area where Prechter is calling for the market to bottom. This area is sub 1000 on the DOW which is why you hear about seeing triple digits on the DOW. One thing you will notice in EW theory is that corrections of larger degree typically come to an end in the area of wave 4 of the preceding wave. So in this case we have wave iv of wave 3 and we will expect to see wave 4 end somewhere in the area of wave iv of wave 3. Once this wave 4 correction is complete, we will see another bull market run which should put us well past the 14000 highs. However, realize that one a scale of this nature, wave 4 will take many years to complete before we see the final wave 5 push.

Here we have a monthly view of the DOW from the 14000 highs. As you can see we have seen 5 waves down from the highs which highlights the crash. This 5 wave sequence down is a larger degree wave 1. Thus we would expect to see a correction for larger wave 2 which we have seen with the post crash recovery to the 11250 or so highs.

Here we have a weekly view of the DOW from the lows of the crash to the 11250 highs which I previously said was a larger wave 2 correction. As you can see the correction was what we would call a triple zigzag correction which is counted WXYXZ.

Finally we have a 4hr view of the DOW from the larger wave 2 highs around 11250. Now we have seen 5 waves down which is marked by waves 1-5. As you can see wave 3 was extended and you can see the 5 wave structure inside marked waves i-v. We would characterize this 5 wave sequence down as a larger wave 1 (which I've marked as wave I) of the much larger wave 3 down. From there we have been in larger wave 2 (which I've marked as WXY where Y is comprised of an abc zigzag) of the much larger wave 3 down. The reason why you hear Pennies talk about starting a much larger wave 3 down is because we will be entering wave 3 of the larger wave 3 down which will be very powerful because wave 3 is typically the strongest wave. Now I want to point out one other thing. If you look at the smaller abc that comprises wave Y you will notice that time wise both waves a and c are very close in terms of how long it took each one to mature (wave a took approximately 26 days or so and wave c is currently around 26 days or so). Additionally if you measure from the wave X lows to the wave b lows you get around 40 days and if compare this to the distance between wave a highs and wave c highs you will get around 40 days. Now this creates a time relationship between the structure which builds a strong case for a top. On top of the time relationship, we also have a relationship between the length of wave a which is around 1000 points and the length of wave c which is around 1000 pips. This makes the relationship between waves a and c roughly equal. Also, if you look at the highs of wave c and draw a horizontal line back to the previous 5 wave drop from the 11250 highs you will see that it corresponds with wave iv of wave 3 down. Like I said earlier, we will typically see corrections end in the 4th wave of the preceding smaller degree structure.
I'm sure that this is a bit overwhelming but hopefully with some careful reading and multiple read throughs, you get the picture. Like I said before, EW theory builds a strong case for a much larger down move which is on the horizon.
Simple,
BGZ is definitely primed for a reversal here. I've been buying BGZ and the VIX at these levels and am now positioned well for a reversal. I think my friend is bullish based on the fact that he believes that the FED and the Obama administration are going to do everything in their power to keep the markets moving up in order to protect the Democrats during elections. Additionally, he is working on some mergers and acquisitions and he said they are seeing a lot of M&A action that should sustain through the end of the fourth quarter. I don't think M&A action is a good judge of the economy based on the fact that its probably picking up because there are some good deals to be had due to the recession. Although, he did say that this past week he was going through some grocery chains and looking at the inflationary/deflationary trends and noticed that their one client is showing deflationary trends. So he is concerned about that but he also argues that inflation is the only options the central bankers have right now.
Simple, it is very interesting that 35 was the factor that relates the crash of 1929 to today. So what is the significance of 35? Well the 9th Fibonacci number in the sequence is 34. So is this a fluke? I doubt it. Now if we can use this relationship as a sort of guide to determine where a depression (if one were to occur similar to the post 1929 crash) might take us we find some very frightful numbers. On July 8, 1932, the DOW closed at 41.22 which was the bottom of the cycle. Now if we take 41.22 and multiply it by 35 we get 1442.7. If we use the Fibonacci number 34 instead of 35 we get 1401.48. Now if you ask me, these are some very scary numbers and I can't even begin to imagine what the economy will be like if we were to drop that far.
Simple,
Thanks for the charts. I'm sure that you are well aware that I'm taking refuge in the bear camp as with the rest of the EW traders here are. I have a dear friend who works at Prudential Capital who is very bullish right now. We've discussed both sides in a lot of depth lately and in my most recent email to him I've presented a few things to him to show why I am still bearish. I think this will help others here see part of my argument and I hope that it will spur some weekend discussion from both bulls and bears here on the board. I find that it is always good to try to understand the other side of the argument because it helps you either find flaws or solidify it. Here is an excerpt from my most recent email to him regarding a comparison b/w the crash of 1929 and the crash we've witnessed in 2008-2009:
I've attached 3 different charts. 2 of the charts show the stock market crash in 1929 and what happened after the crash. The other chart shows a monthly view of the DOW from the 70s through the crash we've just witnessed. The important part I want to point out is how this bounce from the crash looks very similar to the bounce that the market saw post 1929 crash and before the great depression started. I argue that both post crash recoveries look very similar and if this is any indication of whats to come the outlook doesn't look good for the economy. Now like I said above, technical analysis doesn't work 100% of the time and that mass behavior/psychology can change abruptly and alter the outcome. Now that is what the chart looked like and here is an excerpt from "The Story of the Average" written by Robert Rhea where he describes the emotional climate during the 1930 post crash recovery:
"...many observers took it to be a bull market signal. I can remember having shorted stocks early in December, 1929, after having completed a satisfactory short position in October. When the slow but steady advance of January and February carried above [the previous high], I became panicky and covered at considerable loss. ...I forgot that the rally might normally be expected to retrace possibly 66 percent or more of the 1929 downswing. Nearly everyone was proclaiming a new bull market. Services were extremely bullish, and the upside volume was running higher than at the peak in 1929."
I think the important thing to note is his description of what the masses were thinking at the time. They were bullish. I see similarities today as the market has climbed off of the crash lows. Now I don't want to see history repeat itself but I want to be prepared if it does repeat itself.


stargate,
The dollar should be trading much higher. Prechter's group is seeing a bullish dollar scenario to play out along with a large drop in the stock market. This is a similar view to the one that Git posted.
daiello,
The change in leverage will not have an affect on me as I have an account size that can handle the $2k per std lot worth of margin requirements at 50:1. However, you must consider that those trading on a $500 account can't trade at the size they are trading now and withstand large drawdowns due to increased margin requirements. I believe that this will make a lot of traders consider whether or not it is worth trading anymore since they will not be able to trade the same size as they do now and thus their profits (assuming consistent pip gains on smaller sizes) will be lower. Time is money and thats where each person will have to weigh the opportunity costs associated with trading smaller accounts.
Regards,
bio
Permanent Open Market Operations:
The purchase or sale of Treasury securities on an outright basis adds or drains reserves available in the banking system. Such transactions are arranged on a routine basis to offset other changes in the Federal Reserve’s balance sheet in conjunction with efforts to maintain conditions in the market for reserves consistent with the federal funds target rate set by the Federal Open Market Committee (FOMC).
Well looks like the man has caught up with us here in the U.S. who use overseas brokers:
Dear Client:
FXCM would like to inform you of important new legislation passed in the United States that will impact your forex trading account(s). The recently enacted Dodd-Frank Wall Street Reform and Consumer Protection Act is a federal statute that states that overseas brokers not registered with the CFTC will not be able to be counterparties to US retail investors in OTC forex transactions after October 18, 2010.
What does this mean for your account?
As you are a resident of the United States, FXCM LTD (FXCM UK), FXCM AU LTD (FXCM AU) or FXCM Asia Ltd. (FXCM Asia) can no longer be the counterparty for your forex transactions. However, so that you may continue trading, your account(s) are scheduled to be moved the weekend of October 15, 2010 to FXCM LLC (FXCM US). As a US resident having your account(s) with FXCM US will comply with this new rule.
How will my account(s) be affected?
Will my account move?
Yes, your account is scheduled to move the weekend of October 15,2010 to FXCM US.
Will I have the same username and password?
Yes, you will keep the same username and password.
Will I have to download a new platform?
No you will not have to download a new platform.
Will my margin requirements change?
Yes, the maximum leverage available with FXCM US is 50:1 for major currency pairs and 20:1 for exotic currency pairs. (See the table below). For detailed examples on how margin will change and how to avoid a margin call, visit the online support center.
Will my open positions transfer?
All open positions and orders will be transferred to FXCM US. There is no need to close positions.
What will happen to my stops and limits?
All stop and limit orders can remain open during this move. There is no need to remove them.
Will I have hedging on FXCM US?
No, you will no longer be able to open new buy and sell positions on the same currency pair at the same time.
Will I have to do anything?
FXCM will be providing continuous communication over the next few weeks and will outline if there is any further action needed on your part or any changes to this initial communication.
Will my deposit and withdrawal procedures change?
You may continue to visit myfxcm.com to deposit and withdraw funds. Account holders in USD denominated accounts will now send their funds to Bank of America in the United States.
What protection will my account have under the new US regulations?
FXCM is registered with the Commodity Futures Trading Commission (CFTC) and is a member of the National Futures Association (NFA). If a dispute arises, investors can turn to the NFA or the CFTC. Please be aware that once your account has transferred to FXCM US, American (US) requirements and consumer protection rules will apply. The rules made by the UK’s Financial Services Authority to protect consumers will no longer apply; FSA consumer protection, bankruptcy protection, segregated accounts money rules. Any complaints you may have about activities up to the date of transfer will be dealt with under UK rules, thereafter under US.
For additional information, please read the Frequently Asked Questions on the DailyFX Forum. Visit Now
JOIN FXCM for a LIVE ONLINE WEBINAR to ask detailed questions about your account transfer to FXCM US.
Webinar Schedule
Wednesday, September 29 11 a.m.( EST)
Wednesday, September 29 7 p.m.( EST)
Tuesday, October 5 11 a.m.( EST)
Tuesday, October 5 11 a.m.( EST)
JOIN FXCM for a LIVE ONLINE WEBINAR
2% Margin (50:1 leverage)
Major Currency Pairs 10K Standard LLC Accounts
$200 Margin $240 Margin $300 Margin $340 Margin
USD/JPY USD/DKK CHF/JPY EUR/USD GBP/USD
USD/CHF USD/NOK CAD/JPY EUR/CHF GBP/JPY
AUD/USD AUD/CHF CAD/CHF EUR/GBP GBP/CHF
USD/CAD NOK/JPY CHF/SEK EUR/JPY GBP/CAD
NZD/USD SEK/JPY CHF/NOK EUR/AUD GBP/NZD
AUD/CAD NZD/CHF EUR/CAD GBP/AUD
AUD/JPY NZD/CAD EUR/SEK GBP/SEK
NZD/JPY EUR/NOK
AUD/NZD EUR/NZD
USD/SEK EUR/DKK
5% margin (20:1 leverage)
Exotic Currency Pairs 10K Standard LLC Accounts
Exotic (Variable) Margin
USD/MXN ($500) SGD/JPY ($500)
EUR/PLN ($875) USD/TRY ($500)
USD/PLN ($500) EUR/TRY ($875)
EUR/CZK ($875) USD/RUB ($500)
USD/CZK ($500) EUR/HUF ($875)
USD/ZAR ($500) USD/HUF ($500)
USD/SGD ($500) TRY/JPY ($500)
HKD/JPY ($125) ZAR/JPY ($125)
USD/HKD ($500)
Please note that margin requirements are subject to change without notice based on price fluctuations and will be adjusted up or down in increments of $10. We believe that margin requirements will not change more than once a month. Up-to-date margin requirements are displayed in the “Simplified Dealing Rates” window of the trading platform by currency pair.
If you have specific questions about the new regulations, or their effect on your risk management, please do not hesitate to contact us at 1-888-503-6739, or e-mail us at info@fxcm.com.
Best regards,
Forex Capital Markets, LLC
Financial Square
32 Old Slip, 10th Floor
New York, NY 10005
1-888-50-FOREX (36739)
info@fxcm.com
www.fxcm.com
Glad you are enjoying it ST!
Kermit, here is a 4hr look at N/J. I was expecting an impulse series to to the upside however, if you look at the area I have highlighted, it doesn't look like impulses. This means that it must be corrective. I'm going to have to let it develop a bit before coming to any conclusions. I would recommend not taking any trades until we get a clearer picture.

Simple, thank you for the kind words and for posting the info in the ibox. I am sure that others will find value in the information as well. I will definitely set up the second tunnel and keep an eye on it this coming week.
Simple,
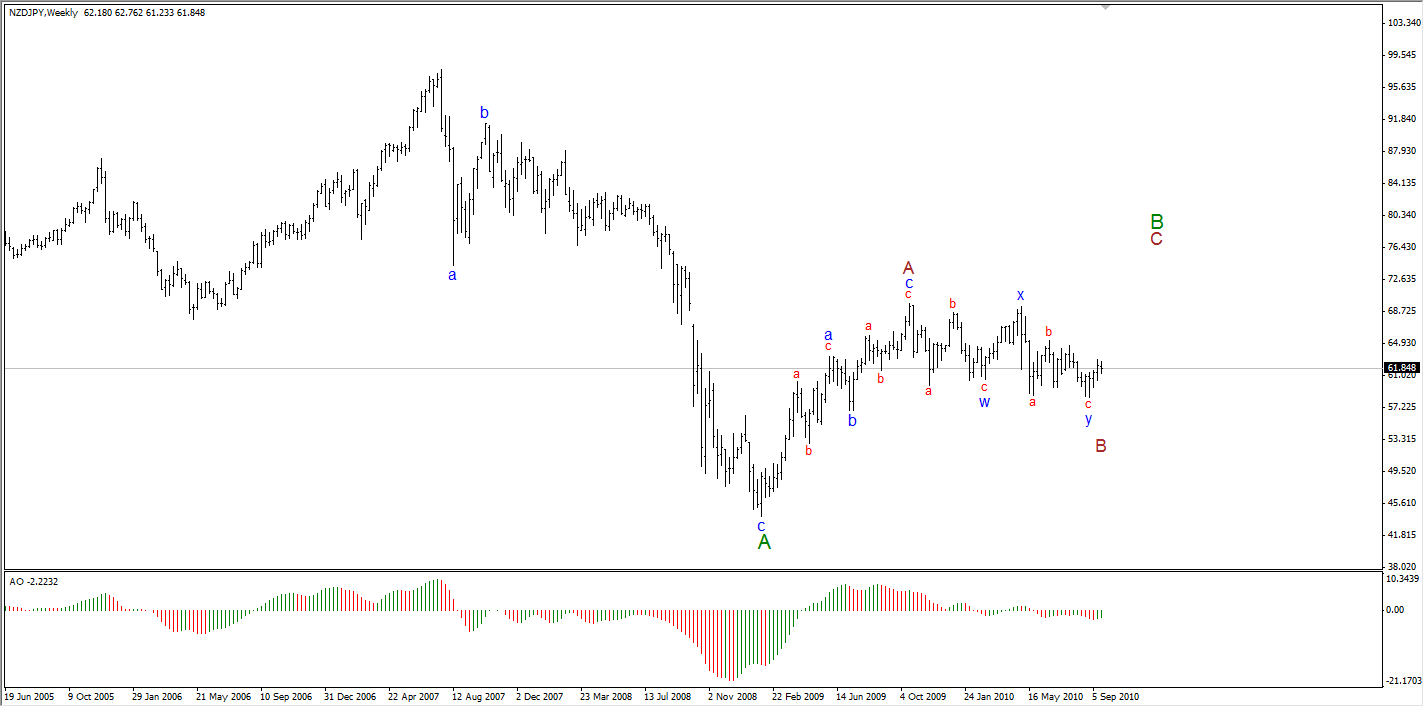
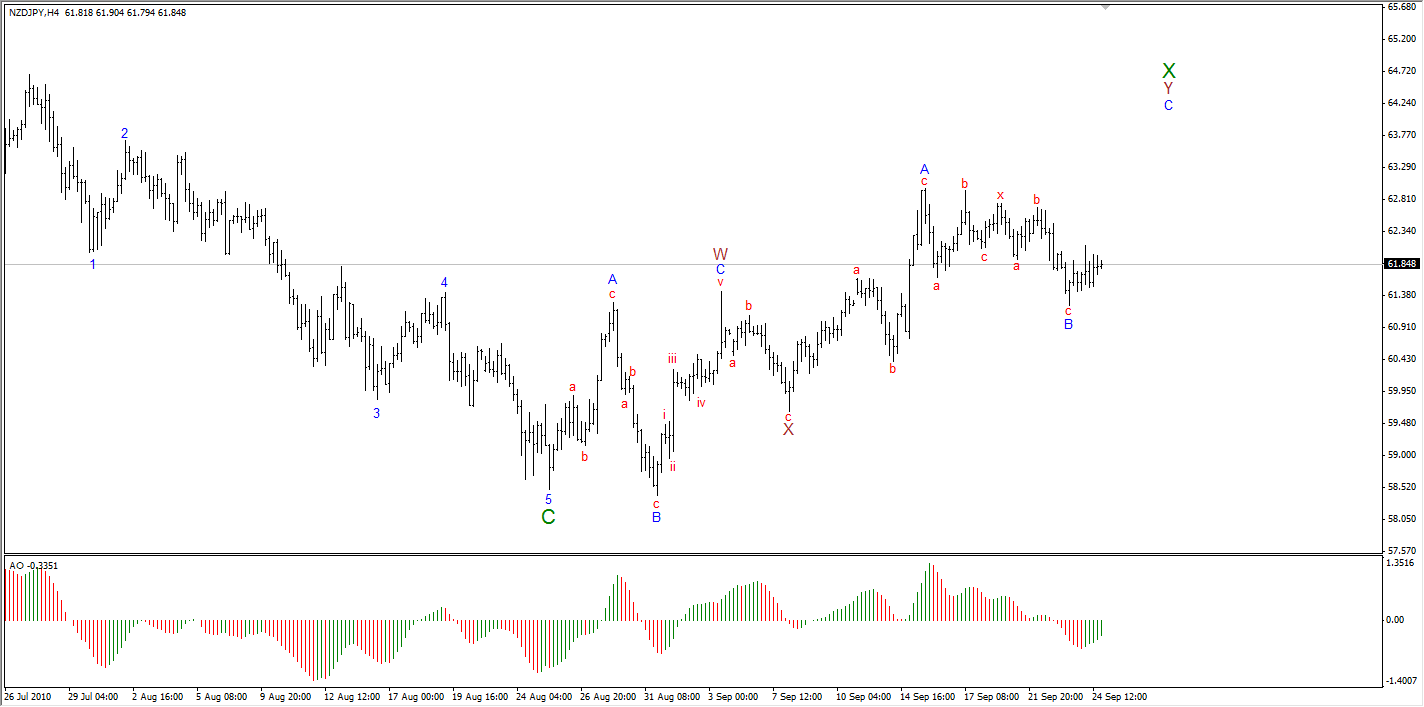
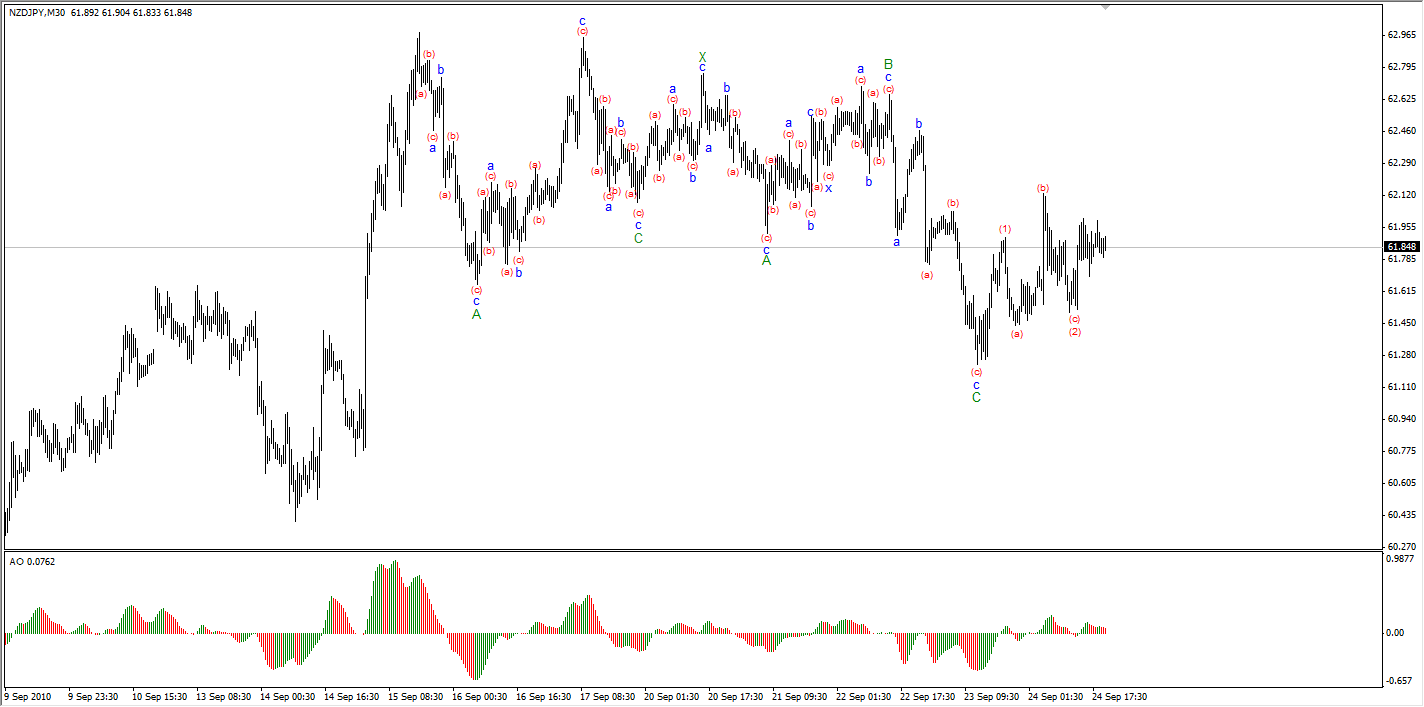
When I begin analyzing a pair, I first start on a larger timeframe such as the monthly or weekly. Once I get a valid count, it gives me an idea of where we are headed on the bigger picture. After looking at the larger picture, I move down to a 4 hour chart and do the same thing. The key is to make sure your counts on the weekly and 4 hour complement each other. So in other words if on the weekly you are expecting to see a 3 wave corrective series or are already in a corrective pattern, then you should be able to see the same counts on the 4 hour. Of course you will get more detail by zooming in and it can be easy to lose focus of where you are in the larger picture. After I complete a 4 hour count and it seems to jive with my weekly count, I move to a 30M and do the same thing. Essentially what this allows me to do is find opportunities of different degree. Now using the weekly as a guide, I can find entries using my 4 hour counts to help confirm my weekly counts. Additionally, I can use the 4 hour as a guide and use the 30M for entries. The nice thing with this is I can position myself on a weekly count for much larger targets of anywhere from say 500-2000 pip moves depending on where we are in the overall sequence while keeping my risk much lower based on using 4 hour entries. I can do the same thing using the 4 hour charts and shoot for targets of maybe 200-400 pips depending on the sequence. The 30M works the same way and usually can yield anywhere from 40-100 pips or so. What I'm working on doing now is trading the 30M counts for the smaller gains until I find a good entry for a larger move on the 4 hour and even further on the weekly. This allows me to trade the smaller waves while holding core positions through the larger waves.
As far as using channel lines, I mainly use them to help project where a specific count may end. For instance, you can get an idea of where wave 5 will end by connecting the lows of waves 2 and 4 and then drawing a parallel line to that from the wave 3 peak. Now you may see things such as under/over throw where wave 5 will fall short or go above the channel lines. This is all dependent upon the strength of the 5th wave. If the 5th wave goes above the channel line it should not stay there long (in other words there should not be a breakout) before moving back inside of the channel. Here is something for you to ponder: I used to trade primarily using S&R and channels can provide some nice trading opportunities. When trading channels, I tend to be more of a counter trend trader because there is a higher probability of the trade panning out in your favor. Now I know it seems like it goes against logic when I say that but consider this: Lets assume we are trading in an channel that is trending upwards. Now naturally as price approaches the top of the channel, buyers exit their positions because they aren't expecting price that has already been moving up in a trend to break out of a channel to the upside (this is a low probability scenario) and sellers begin shorting. Thus, the natural flow causes price to reverse. Now as price approaches the bottom of the channel, things get a bit messier. Naturally, buyers come back into the market in anticipation of the move up from the bottom of the channel. However, sellers who have entered at the top of the channel may take some profits and hold portions in anticipation of a trend reversal. So at this point you don't have the same order flow that you would typically see at the top of the channel. Additionally, you will have sellers with short orders just below the channel in anticipation of trading the break out and trend reversal. Now if you want to see an illustration of what I'm describing just look over some charts and draw channel lines. What you'll notice is that price doesn't deviate much at the top of the channel (meaning that price rarely goes above the top of the channel and when it does the deviation is very small when compared to the deviation you would see at the bottom of the channel. I hope this helps in using channels as a guide. Also note you can project corrections by drawing a trend line from the top of the move to the first pullback (in other words from wave 5 to the wave B pullback) and then draw a parallel line from the first drop from wave 5 (the A wave). This will give you an idea of where Wave C is likely to finish up.
Simple, what you are doing with the tunnel is amazing stuff. In fact, we like to refer to the tunnel as a guide for where corrections are most likely to end. Additionally, Pennies also looks at the Ichimoku Cloud to find areas of S&R. So when we are determining where a correction may end, we first draw some channel lines like I described above. Then we use some fib ratios to project the end of the correction. Then we look at where the tunnel is as well as the cloud. Typically we'll see a confluence and we then know where the correction has the highest probability of ending. Also, it gives us a range or box where price is most likely to turn around.
Here are 3 charts of N/J showing how I manage my counts across several time frames as I mentioned above (Please note that the colors aren't coded to match the counts on the other charts this is something I'm working on as far as how to coordinate the charts so they are more easily understood):
Git, I pulled all of the info from a book written by Robert Balan. Here is a link to the pdf if you're interested. He really goes into depth on correctives and provides a lot of useful insight.
http://rapidshare.com/files/133227119/Balan___Robert_-_Elliott_Wave_Principle_Forex.pdf

