 News
News  Market Data
  Discover
Support: 888-992-3836
Copyright © 2023 InvestorsHub Inc.


rich ruscio
![]()
Register for free to join our community of investors and share your ideas. You will also get access to streaming quotes, interactive charts, trades, portfolio, live options flow and more tools.
Register for free to join our community of investors and share your ideas. You will also get access to streaming quotes, interactive charts, trades, portfolio, live options flow and more tools.
Depositions are fun. Sometimes there's cookies. You could ask for chocolate 
Agreed. And, if Gross is short, he'll need to get out before that happens. Like, now ...
Wheels within wheels ...
Have a good weekend,
rr
There, there. Just let it all out. It'll help you feel better.
Now, go use 7 for a year, and see if you don't pay for it.
And, just as an aside, if I had to to marketing and tech support for a product like 7, and I got to be anon on a board, I'd be named Jessica too. Helps keep the dogs in line, if you smell what I'm cookin'.
Perhaps. Then again, he might be short?
One never knows.
rr
Jer,
I've been there, and it's not that easy
Besides, if you explain it, he'll ask questions, and then I'll learn stuff. and, that's vastly more rewarding to a lot of us little people.
Just trying to create value efficiently while capturing coin.
Have a great weekend,
rr
PnF meets Trends. This should be good.
Just remember to explain Dorsey-isms like BSL.
rr
As I read someplace last night, Gross ALWAYS talks his book. ALWAYS. Therefore, he must be short US T's.
If he is, should I be ...?
Regards,
rr
It's a plan. God bless us all.
rr
great chart. proves to me that when congress is in session it'll cost me money.
there's a conceptually simple fix ...
rr
You could save my mouse wheel a little work by losing that guy with the glove ... so to speak.
rr
Thanks for the news.
As long as you've got Lauren's picture down there, feel free to send along minute by minute updates
rr
Yeah, I thought/think that too.
What was curious to me is that it looks fake, or with less bias, excessively regular. Like letting the air out of a balloon using a pressure regulator, or watching the dial on a sphygmomanometer as the cuff deflates.
Odd looking ...
Anyone ever seen this interesting 'walk down' pattern on the RSI's before?
http://stockcharts.com/c-sc/sc?s=$SPX&p=60&yr=0&mn=0&dy=25&i=p78902631206&a=156264379&r=5092
Gotcha. Me, I'm still on XP, and I've long since forgotten how many of them I've paid for. I agree that V-Ultimate was a rip.
Might I ask: What would you pay for 7?
Regards,
rr
SnPee 60 minute RSI(5) still above 30 ... more to go, down I think.
DYFBPD ...
rr
I understand your issue, and am sorry it happened.
I was all gung ho on Vista, and then it came out, and my really high end techy friends explained why my sanity would be at issue if I tried it.
Nothing but good news from 7, but, ...
rr
That's what I was thinking ... don't insult pigs, don't let anyone here think it was them (OMG, WTF, et al).
Being social, and all.
Ya'll have a nice day,
rr
I keep thinking about it, but then a faster/cheaper/better SSD shows up, and we're getting close to USB3, and next wave Intel cpu's/chipsets ...
Wish I had more money to blow on hardware!
rr
I can do fundamental, too.
With negative earnings TTM real soon, why isn't the SnPee closer to Zero? Bloated pig that it is ...
rr
Yep. I'm hoping they sell a 6-pack.
Have you built many/any x58 board machines yet?
rr
Short and thinking ... maybe another chant ...
"Die you bloated SnPee pig die !!!"
or, is that too technical?
rr
Sounds like a price negotiation / price setting trial balloon to me.
I'd be willing to bet that people who use the RC for free for a year will not go back to XP, or Vista. Gotcha.
Most people who buy machines at retail have no idea what the OS costs. That's Dell's issue.
Schools can never afford anything, so any price matters.
Just buzz ...
JMO, and worth what it cost ...
rr
look way down to the bottom for a check box labeled "Log Scale"
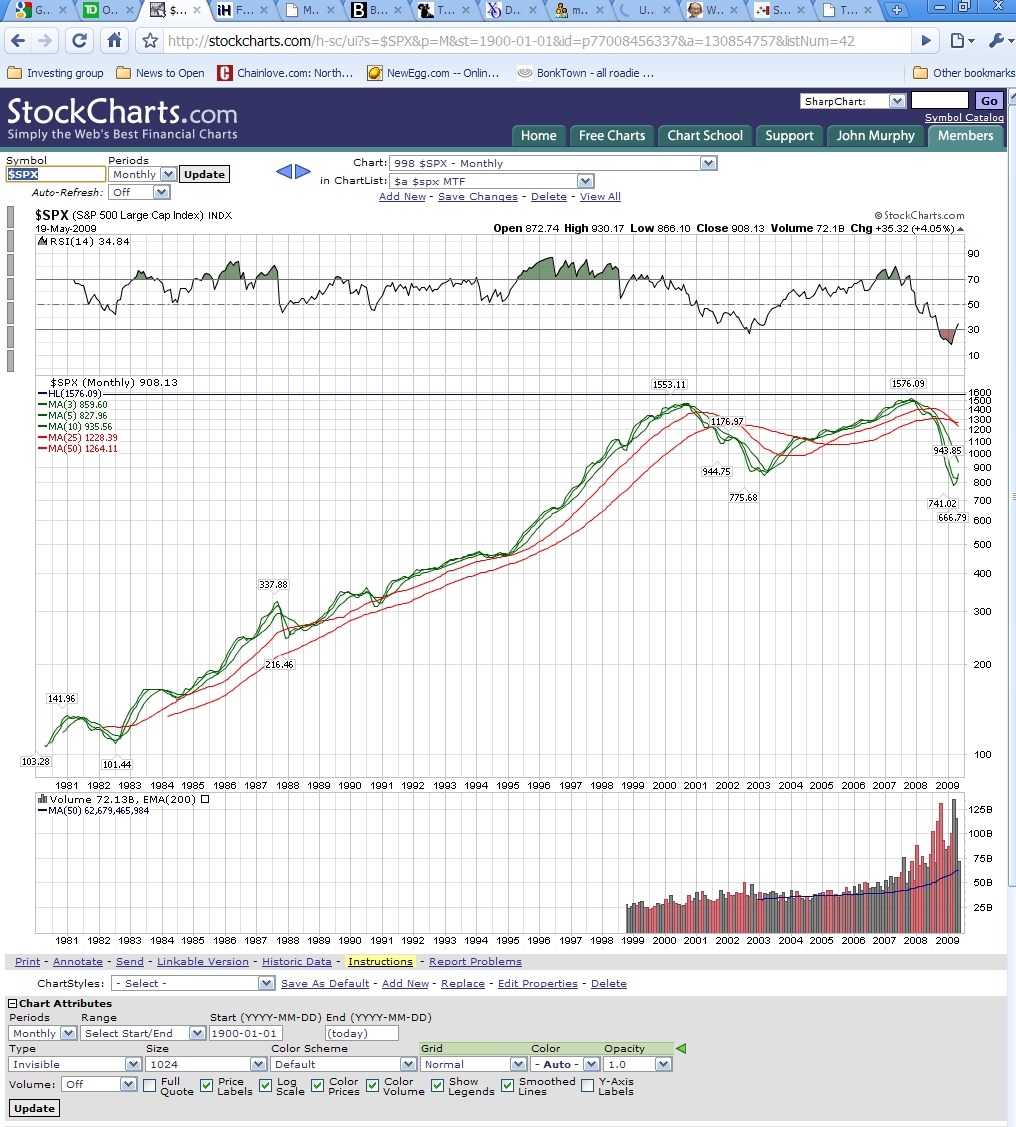
Your eye sees the rise / run of the chart.
As an example, on a linear chart, 3 consecutive 100% moves look 'different' than on a log chart.
Think about the magic of compound interest, or the slippage of a 3x fund reset daily. Same problem. An easy way the see the difference is to go look at $spx monthly for 20 years of so. Look at the scale, and toggle log scale
http://stockcharts.com/c-sc/sc?s=$SPX&p=M&st=1900-01-01&i=p77008456337&a=130854757&r=7720
Log charts make percentage changes over time appear 'linear' to the human brain.
Your preferences may vary.
rr
It's all about the popcorn ...
denmo83,
I wish you the best of luck and life.
In a former existence, I worked for a formerly large photographic giant, and I had the opportunity to know many, many people who had to leave long held positions. I put quite a number of them there personally. Without exception, each of them appears to me to be in at least he same, and in many cases better, circumstances. Not easily, not without stress, to be sure, but better.
Be well,
rr
Understood. Thanks.
rr
I'd look for whoever bought them, and avoid wherever they may be in public. Especially while driving.
rr
I am jealous of your toys.
I do not use RSI as a support / resistance indicator, rather as a trend change indicator. The more pointing the same way, the merrier (multiple time frame analysis, an LG trade mark).
All I try to do with the 1 minute chart method is catch and hold long running trends (long being, like, an hour or so ...).
but the real question is the current SPX going to break 882 ?
yep
you didn't want to know in advance, did you?
rr
triple bottom, last hour or so. last signal short about 2:25 on 1 minute, all rsi's I watch pointed down.
No link. I'm still wondering what TREND1 means when he talks about a '1 minute P&F', and gave it the best interpretation I could. My working presumption is that he set the box size sufficiently small to get an approximation to a 1 minute candlestick chart. But, I won't know until I count boxes, and look at corresponding candles.
I apologize for any confusion I've caused.
There's better things to do with 4 minutes
rr
You wrote:
"Next he will reverse on the Gitmo closing..He ordered that closed without thinking"
Actually, he ordered a years wait before a final determination about what to do.
Plenty of time for several reversals.
I suggest we send bankers who take TARP funds there for reeducation.
rr
A kindred spirit, with my same eyeball issues.
It's good not to be alone.
rr
OT:
LG:
Congratulations. I haven't seen that many mixed messages in such a tiny space in a long time. Very efficient.
rr
the evil speculator, in a latest posting, shows much the same thing. up? up. down? down.
Confirmed signal!
I'm betting on down.
rr
in edit: the link ...
http://evilspeculator.com/?p=7348
JLS,
I would respectfully disagree wrt time 'is not a factor'.
There is a demarcating event when two prices are compared to determine if the P&F chart needs a new mark. On a 'daily' chart, it is the day's data. I'm assuming, but remain uncertain, that on TREND1's '1 minute P&F' chart, it is the minute's data.
Given that, the P&F chart cannot 'grow to the right' faster than a candlestick chart, and will be much more compressed - a narrower chart.
I wanted to look at what difference I might see between a candle and a P&F chart, for 1 minute data, that TREND1 is building. Don't know that I'll see anything, but as Yogi said, it's surprising what you see when you look.
rr
my eyes aren't that great, and no color hard copy output ...
The P&F that I know posts another mark (an x or o, at least 1) if price moves to that 'next box', and reverses direction, and moves to the right (next column) if price reverses by nominally 3 boxes.
My presumption about your chart is that price 'changes' are noted every minute, and the appropriate 'another mark' / 'move to the right' goes on the chart.
I'd like to compare the columns of x's and o's that happen over an hours time, to 60 x 1 minute bars on a candlestick chart.
So rather than the 250 columns on your chart, how about just 60 or so?
rr

