 News
News  Market Data
  Discover
Support: 888-992-3836
Copyright © 2023 InvestorsHub Inc.


techcharter
![]()
Register for free to join our community of investors and share your ideas. You will also get access to streaming quotes, interactive charts, trades, portfolio, live options flow and more tools.
Register for free to join our community of investors and share your ideas. You will also get access to streaming quotes, interactive charts, trades, portfolio, live options flow and more tools.
Bandpass filters by their nature permit a range of frequencies. The band is from 1/2 the center frequency to 2x the center frequency.
Using filters I've seen cycles merge, diverge, and shift over time. This is an additional challenge because the closer cycles become, the more difficult it is to separate them.
Sometimes the cycles are ill defined and can't be used for predictive purposes, so the only thing to do is to wait for a clean signal.
I meant 7.2 years. I was writing from memory.
Even though I'm using the term "cycle", it does not have the specific characteristics as a Hurst cycles with harmonics,nesting of lows, translations, inversions, or straddles. It might be better for me to use the term "oscillation", because the output of band-pass filters are sinusoidal. Hurst's book does briefly touch on spectral analysis, which is my approach; however, since the math is beyond the abilities of many readers, Hurst tried to distill a simple model that more people could understand and apply.
When I searched for longer cycles, there is something in the 19 year duration that might be topping. I do not have enough cycles to get a high confidence reading. I see only a peak, trough, and slowing momentum; which is enough to be on alert for a bear market lasting longer than either 2000 or 2008.
I do believe the FED activity is showing up, but in the amplitude of the 3.3 year cycle. The FED could not stop the 7.2 yr cycle, and businesses are more aligned with a 3.3 year cycle than a longer 7.2 year cycle. That's why I believe the 3.3 year cycle has been the dominant cycle of this last 18 months of the bull market.
OddLot, Your question is perfectly timed.
I've updated my data sets and crunched the numbers for NYA, SPX, and INDU. I'm using bandpass filters to measure the 3.3 yr and 8.3 yr cycles, so there is a slight lag.
The New York Stock Exchange Average (NYA) is a very broad index covering over 2000 companies. The 8.3 year cycle topped in June 2015, and is entering the steepest part of the down phase. The 3.3 year cycle just topped and ticked down this week. The 3.3 year cycle was so strong that it penetrated the bandpass filter for the 8.3 year cycle.
With the larger trend down and the intermediate trend ticking down, there is little upside potential. This phase of the bear market should last a good 12-18 months. I have not been able to adjust the filters to see a 3rd, longer cycle simultaneously with the 3.3 and 8.3 year cycles, but the indication is the longer cycle is topping.
For the SPX and INDU, their 8.3 yr cycles also topped in the June 2015 timeframe. Their 3.3 yr cycles still have not reached top tick, but the upward momentum has pretty much ground to a halt.
Exit all long positions.
DNR - I'm not confident making an accurate E-wave forecast at this time.
SPX - On alert for next big move
The past ~7 days of trading show a triangle Elliott wave. A triangle is consolidation before the last move in the larger trend. This morning's pop in the futures is classic post triangle action. The pop is the last move before another larger consolidation taking the index down to 2600, or THE top of the move out of the 2009 lows.
Bitcoin triangle still in play.
The time line has expanded. The lower converging channel line would be better drawn from the end of WAVE A. Where I drew WAVE B has turned out to be lesser degree Wave C. Wave D is now wrapping up / Wave E starting. The wave continue to give the same message: a major move down is about to take place very soon, and will be very deep.
I Can't Resist Drawing Bitcoin E-Waves
The e-waves on bitcoin are well defined. The 45% plunge from the top is Wave A. Wave B triangle is in subwave D, with subwave E to complete within days.
I'm open to the possibility that Wave C completes a zigzag in a much larger double zigzag pattern, especially since it would be too incredible if bitcoin collapsed more the 90% within 1 month of hitting all-time highs.

Oddlot - 3+yr Cycle
My spectral software also indicates a peak in the 3+yr cycle is near.
Fear Greed Index
The fear-greed index has been at 3 year highs for over a week. Unfortunately the chart only goes back 3 years, but at least it shows conditions just before the late 2015 selloff. This has been a good contrarian indicator for intermediate and long term investors, but not a precise signal for traders.
http://money.cnn.com/data/fear-and-greed/
SPX Sinusoid Chart
The 3.3 year sinusoid is reddish-pink. See how the curve is starting to lose momentum.
The 7.2 year sinusoid is green. you can see how the 3.3 year sinusoid is getting picked up by the 7.2 year filter. This is possible due to the nature of filters.
The blue curve on the bottom is the combination of the 3.3 and 7.2 year cycles. Its tops generally lag the major market turns by ~100 trading days (5 months), and bottoms by ~200 days.
To try to get a signal more in phase with the market (top blue plot) I've plotted the daily change (black) of the combined curve. This is effectively a first derivative that is interpreted as momentum. Presently the moment has broken the line of support from data points 400 to 50, so the combined sinusoids is fast approaching a top. When the momentum was half way from its top in 2007, a market top was within 25 days. So chances are very high a market top is in, or will happen quickly only to reverse.
A momentum reading of 0 is a top/bottom.

My spectral / sinusoidal algorithms are waving huge flags to get out. The difference between the market and model is decreasing, sort of like the concept of MACD. The filter I use to view the ~7.2 year sinusoid is past peak and has a LOT of shorter term sinusoids entering through the side band. This means the shorter term sinusoids are VERY strong. It's like Gibbs phenomena when studying discontinuities using Fourier series. The markets are up due to those overshoots right before the discontinuity occurs. Momentum of the ~3.3 year sinusoid is slowing to the point that has coincided with the 2007 top. There will be no question of a market crash when the ~3.3 and ~7.2 year sinusoids are aligned to the downside in 6-12 months.
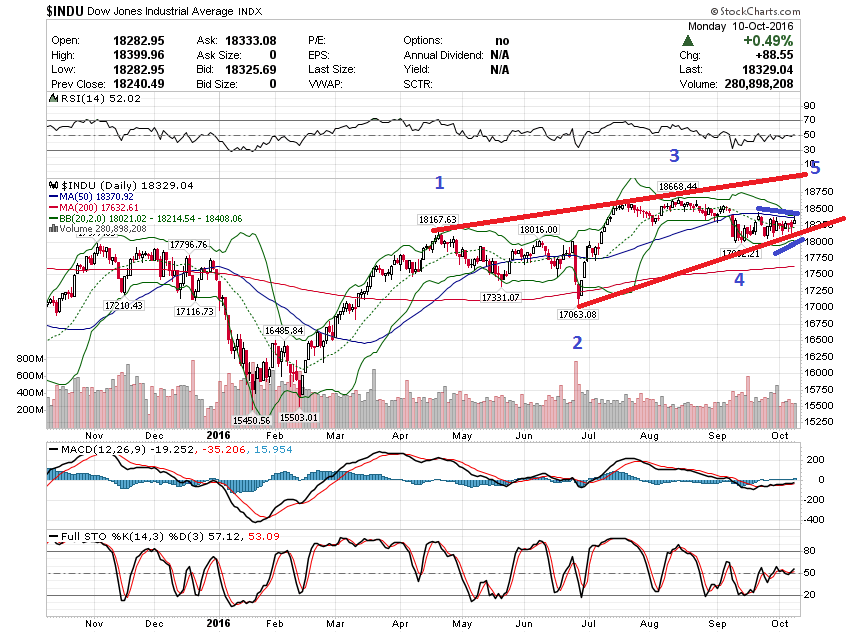
Resolving INDU E-Wave Count Confusion
Counting e-waves since January 2016 in the Dow Industrials has been a challenge. Any 5 wave count looks disproportionate. The wave count I propose does not follow strict rules; however, it contains fewer violations while retaining proportionality.
My premise is the wave from the Jan 2016 lows is an ending diagonal with distortion due to the Federal Reserve.
Wave 1 from Jan 2016 low to Aug 2016 high.
Wave 2 ends in early Nov 2016 lows.
Wave 3 ends at the March 2017 highs.
Wave 4 ends at the May 2017 lows,
Wave 5 ended at August recent highs.
Each segment is clearly a zig-zag; however, waves 1 and 5 do not overlap. I attribute this to the Federal Reserve. Even with the Fed interference, Waves 1 and 3 were nearly equal, while waves 3 and 5 were a fibonacci ratio of 2. What the Federal Reserve could not control was the near fibonacci sequence of 142, 80, and 55 days for the duration of waves 1, 3, and 5, respectively. Waves 2 and 4 are nearly equal, with wave 2 taking a little longer.
How much is the Fed distorting the Industrials?
For waves 1 and 5 to conform to the rules of an ending diagonal, wave 5 must overlap wave 1, so wave 5 would have had to start at least 1932 points lower, or 9.4% lower!!! Ideally wave 5 would have started 3000 points (15%) lower.
The bottom line is wave 5 looks complete, so we'll see if the FED is willing to step in front of a sharp drop of 10-15%.

The worm in the AAPL
Since July 27 of last week, AAPL has traced out a textbook triangle on the intraday charts. The earnings announcement after hours today certainly fulfills the post triangle thrust expectations. This means AAPL is definitely in a topping phase. There could still be another wave 4-5 combination at a higher degree of trend to take place.
The same triangle pattern is as prominent in the NASDAQ. Similar warning short term and potentially long term.
Bear Market Started with a FAANG
This group of darling stocks were holding up the market. With the big choke by Amazon after hours, all FAANG shares have topped and made their turn sharply lower. Global markets should fall very quickly.
The euphoria is at an extreme as indicated by a VIX reading in the high 8's on Wednesday. This is a 5-year low. Margin debt peaked this cycle in April 2017 and has been down for 2 months. July's data will be released shortly. The Baltic Dry Index has fallen by 40% since its counter trend top in March 2017.
I agree another key top is days away. The INDU chart since the late June '17 pullback shows 4 waves of an ending diagonal. The 5th wave has probably started.
DDD Short and Hold
Last week DDD, a 3D printing company, caught my attention by making a daily "loser" list. Having never heard of the company I took a quick look at the chart to interpret its E-wave. They were textbook.
DDD formed a bubble that topped in early 2014. In classic bubble behavior, the price collapsed (Wave A ZIG ), but not all the way to the area where the bubble started. Wave B is a zigzag with again, a textbook triangle separating zig from zag. The zag is done, and larger degree Wave C ZAG has begun. I'm looking for Wave C to end in the price range of $2-$5.
As an alternate count, Wave B could be wave a of 15-20 year corrective triangle.

SPX Futures are up slightly this evening.
But don't let that fool you. The SPX futures topped out early morning on January 26, and traced out a well defined motive wave ending in open market trading on January 30. Since then the SPX futures have traced out a wave 2 flat. The corrective pattern is about to start wave 5 of c as I write. I don't know exactly how the rest of the overnight trading will go; however, I expect at least a 2% drop the rest of the week.
Italian 10 yr bond yields break November 2016 highs. A credit crisis is around the corner.
NED, That was funny.
Always eager to learn or be one of the first to know, I took you seriously and tried googling new ewaves to see what it might look like. I get the Buh-Zinga! today.
Post Triangle Pop Nearly Done
The SPX has 1 maybe 2 more days before prices head lower.
SPX Futures down, tradable E-Wave on Monday.
Since January 6th, the SPX futures have traced out a triangle. Wave e is happening tonight. If you can grab something overnight or premarket it should result in a 20 to 30 SPX point pop. Be nimble because there will be a sharp reverse.
If the futures are already up premarket, wait for the momentum to start heading down in the open market before shorting.
What's a NED?
I haven't been keeping up with Elliott Wave International lately. Patterns are setting up for a high probability then do the opposite. Counts are all over the place. Even confirmation doesn't reduce risk.
The S&P500 futures and open market charts indicate a nearly completed triangle consolidation. There should be one more little push to new all-time highs tomorrow before a price reversal.
I see a triangle.
Both the SPX futures and open market are showing triangles the past 3 days. That means one last, short push higher should take place tomorrow. Then we'll see if the pullback is corrective or new bear.
I don't agree with the argument bonds are selling off due to inflation fears when gold and oil are falling, and US Dollars are rallying. Everything is pointing to deflation and the financial media is trying to help the big boys unload on mom and pop.
WOW, Market Gyrations!
Leading up to the closing of the polls in the US election, financial markets had surged. Once the polls closed, the futures market plunged 5% and hit trading limits. By the end of the day, US financial markets were UP 1.25% from their previous close. All of this still falls within an E-wave count of an ending diagonal that started in late January 2016. NOW the US markets are in Wave 5.
So far the open markets show a double zigzag off Monday's lows, while the futures show a zigzag off the overnight election lows. Structurally the markets are ready to pull back the next few days. Dropping below Monday's lows in the open market would signal the end of the bull market.
NDX - TIIIIIIM-BERRRRRRRR
The NDX traced out a Wave IV triangle from July 2015 until June 2015. Wave V counts as an ending diagonal. Today's intraday low completely retraced Wave V. The probability is VERY high that the rally out of the 2009 low has completed.
Other US markets, (INDU, SPX, WLSH) look like they were forming ending diagonals and truncated on October 24th.
Cracks in the DAX
Elliott wave technical analysis shows the German DAX is at a tipping point. There are two equally probable counts at this time; one bullish and one bearish.
=== The bullish count is labeled in red. ===
The high in the year 2015 is the end of Wave III of a longer wave that started from the 20008-9 lows.
For the rest of 2015 and into early 2016, Wave IV traced out a zig-zag or a possible flat.
Out of the 2016 lows Wave V has so far traced out an ending diagonal, as accentuated with converging blue lines. Presently Wave 5 of the ending diagonal is structurally complete; however, its duration is disproportionally shorter than Waves 1 and 3. While Wave 5 has pushed ever so slightly above the Wave 3 high, Wave 5 would look better if it advanced further to the upper trend line. Much of Wave 5’s time has been spent hugging the lower trend line. It’s as if Wave 5 doesn’t have the force to make it past the middle of the channel as Waves 1 and 3 did. Wave 5’s challenge of the upper trend line is questionable yet could last another 2 weeks winding its way to the 11000 area. Far more certain is Wave V truncation, terminating below the end of Wave III in 2015.
=== The bearish count is labeled in blue. ===
The high in the year 2015 is the end of Wave V.
For the rest of 2015 and into early 2016, Wave A traced out a zig-zag or a complex wave.
Out of the 2016 lows Wave B has so far traced out a triangle. The same comments that apply to the completeness of Wave 5 in the bullish count apply to Wave B in the Bearish count. Wave B is nearly complete, if not already.
=== How deep a sell off ===
Both wave counts convey large losses into next year.
The bullish count has an ending diagonal AND truncation, so the ensuing sell-off should be sharp to the Wave IV area, with a possibility of finding that initial support (Bear Wave 1) before the end of 2016.
The bearish count has a triangle followed by Wave C. The sell off should also find initial support at the end of Wave A, but take more time in doing so.
Financial events to expect may include, but are not limited to:
Deutsche Bank collapse
Italian bond collapse. Yields have shot up >50% on the 10 yr bond over the past 2 months, while breaking the 1 yr downtrend resistance.
Spanish bond collapse. Yields have shot up >50% on the 10 yr bond over the past month, while breaking the 1 yr downtrend resistance.
Greek debt default. GREXIT, GWAR (not the heavy metal band, but the collateralization of Greek debt by the EU sending in troops to Greece)
Financial war via import bans, as Germany wants to do to the UK in retaliation for BREXIT
Financial wars via taxing foreign companies, as US has done to Deutsche Bank after the EU did to Apple.
All the above lead to liquidity problems that result in prices of even gold and silver falling.

Crude Remarks.
I agree. The wave count I'm looking at has a double zigzag counter-trend rally coming out of the early August 2016 lows. connecting the pair of zigzags is a well defined triangle. In the second zigzag, wave b is a little triangle that is also well defined. Today's selling almost retraced the zag of the second zigzag. If the price drops to $49, then odds favor a top being in.
US markets still in wave 4 triangle.
Most likely wave d of 4 triangle that started from the summer highs. It's too difficult to call the timing of the end of wave e.
If wave e finishes into the election, the Ugly American should have an advantage. If wave 5 rallies into the election, then the Crime Syndicate has the advantage.
The winner will have 2.5 months to figure out how to deal with a once in a lifetime depression.
Watch the waves instead of the polls; they are more current.
Wave Recount.
For INDU and SPX, the Wave 5b triangle count is eliminated.
The next best bullish count for INDU is Wave 4 triangle. Time-wise, the Wave 4 triangle is a little shorter than Wave 2 (April-June 2016). Best bearish count is WAVE A1 has started.
The next best bullish count for SPX is confusing since wave c of a triangle would be the smallest of a c e, which violates rules. It is possible Wave 5c truncated. If SPX falls below 2119, then Wave 5 is complete, or Wave 4 is completing.
Regardless of the wave counts the lower support line for the ending diagonal starting in January 2016 is being tested. watch out if prices fall below.
Aside from the wave count update, today was the second day in the past 2 weeks when ALL asset classes sold off. These are tremors of a major liquidity crisis about to unfold.
INDU E-waves Since January 2016 lows
The chart shows the INDU is in the late stages of an ending diagonal (red lines). Wave 5b is a symmetric triangle (blue lines), so one more zigzag should start any day. Wave 5c may have already begun, but it has not penetrated the upper channel line of wave 5b triangle. Many degrees of waves look to top around the time of the US elections in early November. Regardless of the "winner", markets are signaling a sharp reversal with the distinct possibility of finishing the year in the red. With so many too big to fail institutions about to fail, the US elections really can't be THE critical event in the system.
Deutsche Bank, Wells Fargo, Italian banks, college loans, China'a economy, Brexit, Grexit... take your pick.
SPX futures E-wave
It looks like the wave off the Brexit bottom is motive. Wave 4 is a triangle which is nearly complete. There should be a pop-and drop Wednesday.
The DAX is also making a turn; however, it is in a bear market and risks breaking below major support. I think it's the beginning of a 3 of 3 of ..3 crash wave structure. Deutsche Bank is on the ropes, but Turkey will be credited with the cause of the DAX crash.
With the INDU and SPX rising above the June 2016 highs and so close to all-time highs, I'm making my preferred count an ending diagonals. A continued choppy advance would support that pattern.
The long term filtered cycles continue to roll over and remain below their all-time highs. Again, the cycles with shorter periods are supporting the market levels with greater amplitudes that get picked up in the long term filters and appear to distort them.
BREXIT waves
It looks like the short term wave counts in the SPX FTSE and DAX favor the bears.
Wave 1 on Friday was motive.
Wave 2 is a nearly completed flat
Wave 3 starts 6/29, maybe?
Once Wave 3 starts it will be much stronger than Wave 1. The January/February lows will be challenged. For Germany this could be a 15% to 20% drop over the course of a week.
Short CACC
It deals with sub-prime car loans. It had an exponential blow off and has been under distribution for the past year. The price is making lower lows followed by lower highs. The past week the downside volume is increasing. Crash is imminent.
Delayed Report
I ran the calculations and projections for the SPX and then left my memory stick and my girlfriend's house. It's a long drive so I'll have to try again this weekend.
Anyway, the rally in the US dollar, 10yr US bond, German Bund yield below 0%, and relative strength in the US stock markets relative to DAX and FTSE indicate a panic rotation is taking place.
My cycle model was calling for a MUCH stronger sell-off in equities with the amplitude of the 20 week cycle being 125 points. Just as the 20 week cycle rolled over, some very strong, short term money came into support Western markets. Maybe this was a last ditch effort so friends could sell the rally. Maybe it was to manipulate the BREXIT referendum. This force is in the 20 - 34 day cycle range. IT is so strong that it has been picked up by the 20 week filters and appears to thwart the 20 week cycle's down-phase. The 20 week cycle is still heading lower. We just can't see it clearly. The growing violence and support for BREXIT are indicators of the same strength of emotions which drove the markets lower in January and early February this year.
Quick Cycle Observations
I'll have a more complete cycle analysis, including charts this weekend. My initial check of what's going on intermediate and long term is the 7.4 year is entering its strongest downside phase. The 3.3 year cycle is looking to bottom or invert in 4-5 months. The 100 day cycle has topped and is in the strongest downside phase.
The fact that all 3 dominant cycles are in their down phases while markets test all-time highs indicates the divergence is made up of shorter cycles with larger amplitudes. This raises the possibility of a VERY sharp reversal in the next 2-3 weeks.
There are some glaring non-confirmations in Western markets. While the SPX and INDU challenge all-time highs, the DAX and FTSE are still a good 10% away from challenging their all-time highs.
I'm at a loss for e-wave counts seeing so many zig-zags heading up, but not overlapping.
Primary short term SPX wave count. And cycle babble
Wave 1 of WAVE 3 - From this April's high to this May's low
Wave 2 of WAVE 3 - From this May's low to present. Flat in wave c
-------------------------------
The 10 day cycle is topping.
The 20 week cycle is entering its strongest selling.
The 3.4 yr cycle is down; however, ~4 month to bottom.
the 7.3 yr cycle is entering its strongest selling.
The 10 day cycle has the rest of this week to support the market. Then 4 strong cycles will be synchronized to the downside next week. June should be pretty red.
SPX Filtered Cycles Pointing Lower
The 3.3 yr and 7.4 yr cycles are pointing down.
The 20 week cycle is entering its hard down phase with a potential of >150 points. The combined 20 and 34 day cycles are ready to rally, but at a strength of about 15 points. With the 20 week cycle heading lower, the 20/34 cycle could get swallowed or invert and gain strength to the downside.
WTIC still in ending diagonal
The zigzag count off the February 2016 lows is still the preferred count. The zag is still an ending diagonal. My original count 2 weeks ago was wave 5 just finishing up. It turns out it was only wave b of 3. WTIC is NOW in wave c of 5 of the ending diagonal of zag. WTIC's corrective rally should top this week and plunge to the $36 area rather quickly.

